The table given below shows a record of the weight in kilogram of 100 students of a school.
| Weight (kg) | No. of Students |
|---|---|
| 30 – 35 | 5 |
| 35 – 40 | 7 |
| 40 – 45 | 14 |
| 45 – 50 | 21 |
| 50 – 55 | 25 |
| 55 – 60 | 15 |
| 60 – 65 | 7 |
| 65 – 70 | 6 |
Draw a histogram and find the modal weight.
[Take 2 cm = 5 kg along one axis and 2 cm = 5 students along the other axis]
Show SolutionHide Solution↓
Steps :
Take 2 cm = 5 kg along the x-axis.
Take 2 cm = 5 students along the y-axis.
Draw the rectangles (bars) for the given class intervals, taking the corresponding frequencies as their heights.
The class interval 50 - 55 has the highest frequency 25, so 50 - 55 is the modal class.
In the highest rectangle, draw two lines AD and BC from corners of the rectangles on either side of the highest rectangle to the opposite corners of the highest rectangle. Let P be the point of intersection of AD and BC.
From the point of intersection P, draw a perpendicular to the x-axis. The point R = 51.5, where this perpendicular meets the x-axis gives the mode.
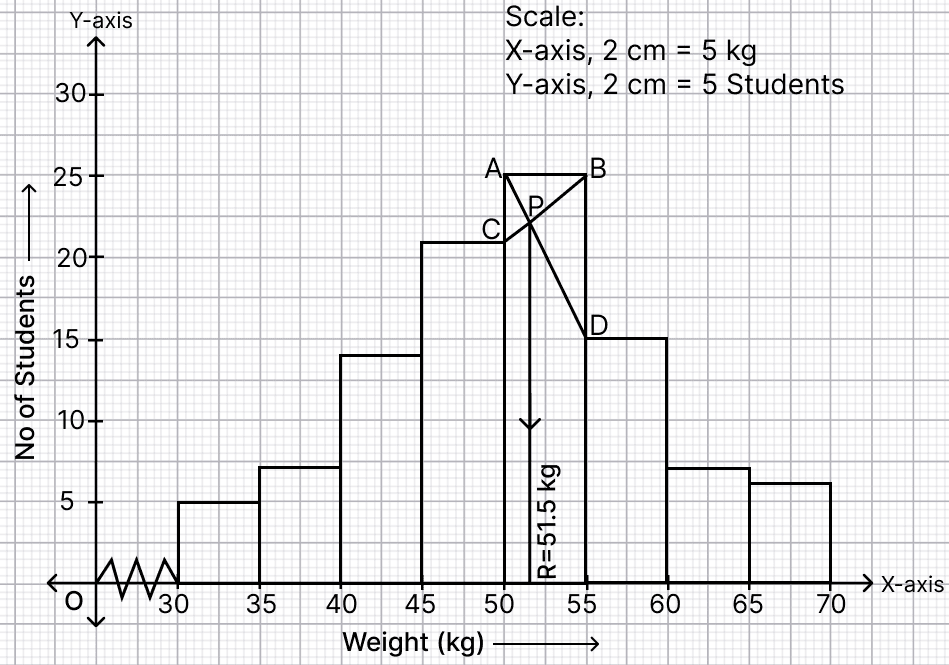
From the histogram,
Mode = 51.5 kg.
Hence, modal weight = 51.5 kg.