4(iii)
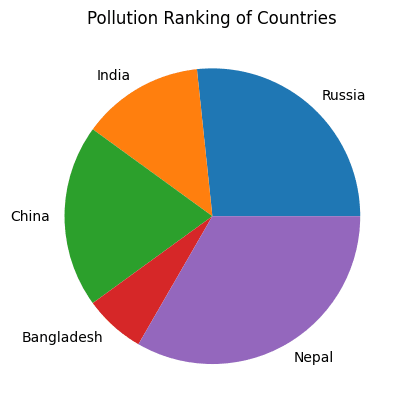
Write a Python program to plot a pie chart comparing pollution ranking of five countries as given below:
Country = ['Russia', 'India', 'China', 'Bangladesh', 'Nepal']
Pollution = [4, 2, 3, 1, 5]
Import the necessary libraries.
Show SolutionHide Solution↓
import matplotlib.pyplot as plt

Country = ['Russia', 'India', 'China', 'Bangladesh', 'Nepal']
Pollution = [4, 2, 3, 1, 5]

plt.pie(Pollution, labels=Country)
plt.title("Pollution Ranking of Countries")
plt.show()
Output