Measures of Central Tendency

ICSE Class 10 Mathematics · ML Aggarwal Mathematics · 99 solved questions

Exercise
Marks
1Exercise 21.1

Calculate the arithmetic mean of 5.7, 6.6, 7.2, 9.3, 6.2.

Show SolutionHide Solution↓

The sum of terms = 5.7 + 6.6 + 7.2 + 9.3 + 6.2 = 35

Number of terms = 5

Arithmetic mean (A.M.) = $\frac{\text{Sum of terms}}{\text{No. of terms}} = \frac{∑x_i}{n}$

$\therefore A.M. = \frac{35}{5} = 7.$

Hence, the mean of 5.7, 6.6, 7.2, 9.3, 6.2 is 7.

2Exercise 21.1

The marks obtained by 15 students in a class test are 12, 14, 07, 09, 23, 11, 08, 13, 11, 19, 16, 24, 17, 03, 20. Find :

(i) the mean of their marks.

(ii) the mean of their marks when the marks of each student are increased by 4.

(iii) the mean of their marks when 2 marks are deducted from the marks of each student.

(iv) the mean of their marks when the marks of each student are doubled.

Show SolutionHide Solution↓

(i) The sum of marks of all students = 12 + 14 + 07 + 09 + 23 + 11 + 08 + 13 + 11 + 19 + 16 + 24 + 17 + 03 + 20 = 207.

$$\begin{aligned}\therefore \text{The mean of marks} = \frac{\text{Sum of marks of all students}}{\text{No. of students}} = \frac{∑x_i}{n} \\[1em] = \frac{207}{15} \\[1em] = 13.8\end{aligned}$$

Hence, the mean of marks of 15 students is 13.8

(ii) When the marks of each student are increased by 4, then the sum of their marks increases by 15 × 4 i.e. by 60.

∴ The new sum of marks of all students = 207 + 60 = 267.

$$\begin{aligned}\therefore \text{The new mean of marks} = \frac{\text{ New sum of marks}}{\text{No. of students}} \\[1em] = \frac{267}{15} \\[1em] = 17.8\end{aligned}$$

Hence, the mean of marks of 15 students, when the marks of each student are increased by 4 is 17.8

(iii) When the marks of each student is decreased by 2, then the sum of their marks decreases by 15 × 2 i.e. by 30.

∴ The new sum of marks of all students = 207 - 30 = 177.

$$\begin{aligned}\therefore \text{The new mean of marks} = \frac{\text{ New sum of marks}}{\text{No. of students}} \\[1em] = \frac{177}{15} \\[1em] = 11.8\end{aligned}$$

Hence, the mean of marks of 15 students, when the marks of each student is decreased by 2 is 11.8

(iv) When the marks of each student are doubled, then the sum of their marks will also be doubled.

∴ The new sum of marks of all students = 207 × 2 = 414.

$$\begin{aligned}\therefore \text{The new mean of marks} = \frac{\text{ New sum of marks}}{\text{No.of students}} \\[1em] = \frac{414}{15} \\[1em] = 27.6\end{aligned}$$

Hence, the mean of marks of 15 students, when the marks of each student is doubled is 27.6

3(a)Exercise 21.1

The mean of the numbers 6, y, 7, x, 14 is 8. Express y in terms of x.

Show SolutionHide Solution↓

Arithmetic mean (A.M.) = $\frac{\text{Sum of terms}}{\text{No. of terms}} = \frac{∑x_i}{n}$

$$\begin{aligned}\therefore 8 = \frac{6 + y + 7 + x + 14}{5} \\[1em] \Rightarrow 8 = \frac{x + y + 27}{5} \\[1em] \Rightarrow 40 = x + y + 27 \\[1em] \Rightarrow x + y = 13 \\[1em] \Rightarrow y = 13 - x.\end{aligned}$$

Hence, the value of y = 13 - x.

3(b)Exercise 21.1

The mean of 9 variates is 11. If eight of them are 7, 12, 9, 14, 21, 3, 8 and 15, find the 9th variate.

Show SolutionHide Solution↓

Let 9th variate be x.

Sum of terms = 7 + 12 + 9 + 14 + 21 + 3 + 8 + 15 + x = 89 + x

Number of terms = 9.

Arithmetic mean (A.M.) = $\frac{\text{Sum of terms}}{\text{No. of terms}}$

Given, A.M. = 11

$$\begin{aligned}\therefore 11 = \frac{89 + x}{9} \\[1em] \Rightarrow 99 = 89 + x \\[1em] \Rightarrow x = 99 - 89 \\[1em] \Rightarrow x = 10.\end{aligned}$$

Hence, the value of 9th variate is 10.

4(a)Exercise 21.1

The mean age of 33 students of a class is 13 years. If one girl leaves the class, the mean becomes $12\frac{15}{16}$ years. What is the age of the girl ?

Show SolutionHide Solution↓

$$\begin{aligned}\text{Arithmetic mean (A.M.)} = \frac{\text{Sum of age of students}}{\text{No.of students}} \\[1em] \Rightarrow 13 = \frac{\text{Sum of age of students}}{33} \\[1em] \Rightarrow \text{Sum of age of students} = 33 \times 13 \\[1em] \Rightarrow \text{Sum of age of students} = 429.\end{aligned}$$

Let the age of girl that leaves the class be x. So, sum of age of students becomes 429 - x and total no of students = 32. Given, new mean = $12\frac{15}{16}$.

$$\begin{aligned}\therefore 12\frac{15}{16} = \frac{429 - x}{32} \\[1em] \frac{207}{16} = \frac{429 -x}{32} \\[1em] 207 \times 32 = 16(429 - x) \\[1em] 6624 = 6864 - 16x \\[1em] 16x = 6864 - 6624 \\[1em] 16x = 240 \\[1em] x = \frac{240}{16} = 15.\end{aligned}$$

Hence, the age of girl is 15 years.

4(b)Exercise 21.1

In a class test, the mean of marks scored by a class of 40 students was calculated as 18.2. Later on, it was detected that the marks of one student was wrongly copied as 21 instead of 29. Find the correct mean.

Show SolutionHide Solution↓

$$\begin{aligned}\text{ Mean of marks} = \frac{\text{Incorrect sum of marks}}{\text{No. of students}} \\[1em] \Rightarrow 18.2 = \frac{\text{Incorrect sum of marks}}{40} \\[1em] \Rightarrow \text{Incorrect sum of marks} = 40 \times 18.2 \\[1em] \Rightarrow \text{Incorrect sum of marks} = 728.\end{aligned}$$

As the marks of one student was wrongly copied as 21 instead of 29, correct sum of marks = 728 - 21 + 29 = 736.

$$\begin{aligned}\therefore \text{Correct mean } = \frac{\text{Correct sum of marks}}{\text{No. of students}} \\[1em] = \frac{736}{40} = 18.4\end{aligned}$$

Hence, the correct mean is 18.4.

5Exercise 21.1

Find the mean of 25 given numbers when the mean of 10 of them is 13 and the mean of the remaining numbers is 18.

Show SolutionHide Solution↓

$$\begin{aligned}\text{Arithmetic mean (A.M.)} = \frac{\text{Sum of terms}}{\text{No. of terms}} \\[1em] \therefore \text{Sum of terms} = \text{A.M.} \times \text{No. of terms}.\end{aligned}$$

Given, mean of 10 numbers is 13.

∴ Sum of 10 terms = 13 × 10 = 130.

Given, mean of 15 numbers is 18.

∴ Sum of 15 terms = 15 × 18 = 270.

Sum of 25 terms = 130 + 270 = 400.

$\therefore A.M. = \frac{400}{25} = 16$

Hence, the mean of 25 numbers is 16.

6Exercise 21.1

Find the mean of the following distribution :

NumberFrequency
51
102
155
206
253
302
351
Show SolutionHide Solution↓

We construct the following table:

xififixi
515
10220
15575
206120
25375
30260
35135
Total20390

Mean = $\frac{∑f_ix_i}{∑f_i} = \frac{390}{20}$ = 19.5

Hence, the mean of the following distribution is 19.5

7Exercise 21.1

The contents of 100 matchboxes were checked to determine the number of matches they contained.

No. of matchesNo. of boxes
356
3610
3718
3825
3921
4012
418

(i) Calculate, correct to one decimal place, the mean number of matches per box.

(ii) Determine how many extra matches would have to be added to the total contents of the 100 boxes to bring the mean upto exactly 39 matches.

Show SolutionHide Solution↓

(i) We construct the following table:

xififixi
356210
3610360
3718666
3825950
3921819
4012480
418328
Total1003813

Mean = $\frac{∑f_ix_i}{∑f_i} = \frac{3813}{100}$ = 38.1

Hence, the mean of number of matches per box is 38.1

(ii) Mean = $\frac{\text{No. of matches}}{\text{No. of boxes}}$

Let the no. of matches added to total contents of 100 boxes be x in order to bring mean to 39. So, total matches becomes 3813 + x.

$$\begin{aligned}\therefore 39 = \frac{3813 + x}{100} \\[1em] \Rightarrow 3900 = 3813 + x \\[1em] \Rightarrow x = 3900 - 3813 = 87.\end{aligned}$$

Hence, 87 extra matches need to added to bring the mean upto exactly 39 matches.

8Exercise 21.1

Find the mean for the following distribution by short cut method:

NumbersCumulative Frequency
608
6118
6233
6340
6449
6555
6660
Show SolutionHide Solution↓

We construct the following table as under taking the assumed mean, a = 63.

xiCumulative frequencyfiDeviation (di = xi - a)fidi
6088-3-24
611818 - 8 = 10-2-20
623333 - 18 = 15-1-15
634040 - 33 = 700
644949 - 40 = 919
655555 - 49 = 6212
666060 - 55 = 5315
Total60-23

Mean = $a + \frac{∑f_id_i}{∑f_i} = 63 + \frac{-23}{60} = 63- 0.38$ = 62.62.

Hence, the mean of the following distribution is 62.62.

9Exercise 21.1
CategoryWages in ₹ per dayNo. of workers
A5002
B6004
C7008
D80012
E90010
F10006
G11008

(i) Calculate the mean wage, correct to the nearest rupee.

(ii) If the number of workers in each category is doubled, what would be the new mean wage?

Show SolutionHide Solution↓

(i) We construct the following table:

CategoryWages in ₹ per day (xi)No. of workers (fi)fixi
A50021000
B60042400
C70085600
D800129600
E900109000
F100066000
G110088800
TotalΣfi = 50Σfixi = 42400

Mean = $\frac{Σf_ix_i}{Σf_i}$

= $\frac{42400}{50}$

= 848.

Hence, the mean wage is ₹ 848.

(ii) If the number of workers in each category is doubled then total wage will also be doubled.

New total wage = 42400 × 2 = 84800 and number of workers = 50 × 2 = 100.

Mean = $\frac{\text{New total wage}}{\text{No. of workers}}$

= $\frac{∑f_ix_i}{∑f_i}$

= $\frac{84800}{100}$​ = 848.

Hence, the new mean wage is also ₹ 848.

10Exercise 21.1

The mean of the following data is 16. Calculate the value of f.

MarksNo. of students
53
107
15f
209
256
Show SolutionHide Solution↓
Marks (xi)No. of students (fi)fixi
5315
10770
15f15f
209180
256150
TotalΣfi = 25 + fΣfixi = 415 + 15f

By formula; Mean = $\frac{Σf_ix_i}{Σf_i}$

Substituting the values, we get

$$\begin{aligned}\Rightarrow 16 = \frac{415 + 15f}{25 + f}\\[1em] \Rightarrow 16(25 + f) = 415 + 15f\\[1em] \Rightarrow 400 + 16f = 415 + 15f\\[1em] \Rightarrow 16f - 15f = 415 - 400\\[1em] \Rightarrow f = 15.\end{aligned}$$

Hence, the value of f = 15.

11Exercise 21.1

Marks obtained by 40 students in a short assessment is given below, where a and b are two missing data :

MarksNo. of students
56
6a
716
813
9b

If the mean of the distribution is 7.2, find a and b.

Show SolutionHide Solution↓

We construct the following table:

Marks (xi)No. of students (fi)fixi
5630
6a6a
716112
813104
9b9b
Total35 + a + b246 + 6a + 9b

Given, total no. of students = 40 and mean = 7.2

∴ 35 + a + b = 40
⇒ a + b = 5
⇒ a = 5 - b      .....(i)

$$\begin{aligned}\text{Mean} = \frac{∑f_ix_i}{∑f_i} \\[1em] \therefore 7.2 = \frac{246 + 6a + 9b}{40} \\[1em] \Rightarrow 288 = 246 + 6a + 9b \\[1em] \Rightarrow 288 - 246 = 6a + 9b \\[1em] \Rightarrow 6a + 9b = 42\end{aligned}$$

Putting value of a from Eq (i)

$$\begin{aligned}\Rightarrow 6(5 - b) + 9b = 42 \\[1em] \Rightarrow 30 - 6b + 9b = 42 \\[1em] \Rightarrow 30 + 3b = 42 \\[1em] \Rightarrow 3b = 12 \\[1em] \Rightarrow b = 4.\end{aligned}$$

a = 5 - b = 5 - 4 = 1.

Hence, the value of a = 1 and b = 4.

12Exercise 21.1

Calculate the mean of the following distribution:

Class intervalFrequency
5 - 152
15 - 256
25 - 354
35 - 458
45 - 554
Show SolutionHide Solution↓
ClassClass-mark (yi)Frequency (fi)fiyi
5 - 1510220
15 - 25206120
25 - 35304120
35 - 45408320
45 - 55504200
TotalΣfi = 24Σfiyi = 780

$$\begin{aligned}\text{Mean }= \frac{∑f_iy_i}{∑f_i}\\[1em] = \frac{780}{24}\\[1em] = 32.5\end{aligned}$$

Hence, mean of the following distribution is 32.5.

13Exercise 21.1

Calculate the mean of the following distribution :

Class intervalFrequency
0 - 108
10 - 205
20 - 3012
30 - 4035
40 - 5024
50 - 6016
Show SolutionHide Solution↓

We construct the following table:

ClassesClass mark (yi)Frequency (fi)fiyi
0 - 105840
10 - 2015575
20 - 302512300
30 - 4035351225
40 - 5045241080
50 - 605516880
Total1003600

∴ Mean = $\frac{∑f_iy_i}{∑f_i} = \frac{3600}{100}$ = 36.

Hence, mean of the following distribution is 36.

14Exercise 21.1

Calculate the mean of the following distribution using step deviation method :

MarksNumber of students
0 - 1010
10 - 209
20 - 3025
30 - 4030
40 - 5016
50 - 6010
Show SolutionHide Solution↓

We construct the following table, taking assumed mean a = 25.
Here, c (width of each class) = 10.

Marks (Classes)Class mark (yi)$u_i = \frac{y_i - a}{c}$No. of students (Frequency (fi))fiui
0 - 105-210-20
10 - 2015-19-9
20 - 30250250
30 - 403513030
40 - 504521632
50 - 605531030
Total10063

$$\begin{aligned}\therefore \text{ Mean} = a + c \times \frac{∑f_iu_i}{∑f_i} \\[1em] = 25 + 10 \times \frac{63}{100} \\[1em] = 25 + \frac{630}{100} \\[1em] = 25 + 6.3 \\[1em] = 31.3\end{aligned}$$

Hence, mean of the following distribution is 31.3

15Exercise 21.1

The data on the number of patients attending a hospital in a month is given below. Find the average (mean) number of patients attending the hospital in a month using the short cut method.

Take assumed mean as 45. Give your answer correct to 2 decimal places.

Number of patientsNumber of days
10 - 205
20 - 302
30 - 407
40 - 509
50 - 602
60 - 705
Show SolutionHide Solution↓

Construct table as under, taking assumed mean a = 45.

Number of patients (Classes)Class mark (yi)Deviation (di = yi - a)Number of days (Frequency (fi))fidi
10 - 2015-305-150
20 - 3025-202-40
30 - 4035-107-70
40 - 5045090
50 - 605510220
60 - 7065205100
Total30-140

$$\begin{aligned}\therefore \text{ Mean} = a + \frac{∑f_id_i}{∑f_i} \\[1em] = 45 + \frac{-140}{30} \\[1em] = 45 + (-4.67) \\[1em] = 40.33\end{aligned}$$

Hence, mean of the following distribution is 40.33

16Exercise 21.1

The following table gives the daily wages of worker in a factory:

Wages in ₹No. of workers
450 - 5005
500 - 5508
550 - 60030
600 - 65025
650 - 70014
700 - 75012
750 - 8006

Calculate their mean by short cut method.

Show SolutionHide Solution↓

We construct the following table as under taking the assumed mean, a = 625.

ClassClass - mark (xi)Frequency (fi)Deviation (di = xi - a)fidi
450 - 5004755-150-750
500 - 5505258-100-800
550 - 60057530-50-1500
600 - 6506252500
650 - 7006751450700
700 - 750725121001200
750 - 8007756150900
TotalΣfi = 100Σfidi = -250

By formula,

$$\begin{aligned}\text{Mean }= a + \frac{∑f_id_i}{∑f_i}\\[1em] = 625 + \frac{-250}{100}\\[1em] = 625 - 2.5\\[1em] = 622.5\end{aligned}$$

Hence, mean of the following distribution is ₹622.5.

17Exercise 21.1

Calculate the mean of the distribution given below using the short cut method.

MarksNo. of students
11 - 202
21 - 306
31 - 4010
41 - 5012
51 - 609
61 - 707
71 - 804
Show SolutionHide Solution↓

Construct the table as under, taking assumed mean as 45.5

Marks (Classes)Class mark (yi)Deviation (di = yi - a)No. of students (Frequency (fi))fidi
11 - 2015.5-302-60
21 - 3025.5-206-120
31 - 4035.5-1010-100
41 - 5045.50120
51 - 6055.510990
61 - 7065.5207140
71 - 8075.5304120
Total5070

$$\begin{aligned}\therefore \text{ Mean} = a + \frac{∑f_id_i}{∑f_i} \\[1em] = 45.5 + \frac{70}{50} \\[1em] = 45.5 + 1.4 \\[1em] = 46.9\end{aligned}$$

Hence, mean of the following distribution is 46.9 marks

18Exercise 21.1

A class teacher has the following absentee record of 40 students of a class for the whole term. Find the mean number of days a student was absent.

No. of daysNo. of students
0 - 611
6 - 1010
10 - 147
14 - 204
20 - 284
28 - 383
38 - 401
Show SolutionHide Solution↓

We construct the following table :

No. of days (Classes)Class mark (yi)No. of students (Frequency (fi))fiyi
0 - 631133
6 - 1081080
10 - 1412784
14 - 2017468
20 - 2824496
28 - 3833399
38 - 4039139
Total40499

∴ Mean = $\frac{∑f_iy_i}{∑f_i} = \frac{499}{40}$ = 12.475

Hence, mean of the following distribution is 12.475

19Exercise 21.1

If the mean of the following distribution is 24, find the value of a :

MarksNumber of students
0 - 107
10 - 20a
20 - 308
30 - 4010
40 - 505
Show SolutionHide Solution↓

We construct the following table :

Marks (Classes)Class mark (yi)Number of students (Frequency (fi))fiyi
0 - 105735
10 - 2015a15a
20 - 30258200
30 - 403510350
40 - 50455225
Total30 + a810 + 15a

$$\begin{aligned}\therefore \text{Mean} = \frac{∑f_iy_i}{∑f_i} \\[1em] \Rightarrow 24 = \frac{810 + 15a}{30 + a} \\[1em] \Rightarrow 24(30 + a) = 810 + 15a \\[1em] \Rightarrow 720 + 24a = 810 + 15a \\[1em] \Rightarrow 24a - 15a = 810 - 720 \\[1em] \Rightarrow 9a = 90 \\[1em] \Rightarrow a = 10.\end{aligned}$$

Hence, the value of a = 10.

20Exercise 21.1

The mean of the following distribution is 50. Find the unknown frequency.

Class IntervalFrequency
0 - 206
20 - 40f
40 - 608
60 - 8012
80 - 1008
Show SolutionHide Solution↓
Class IntervalClass mark (xi)Frequency (fi)fixi
0 - 2010660
20 - 4030f30f
40 - 60508400
60 - 807012840
80 - 100908720
TotalΣfi = 34 + fΣfixi = 2020 + 30f

By formula,

Mean = $\frac{∑f_ix_i}{∑f_i}$

Substituting values we get :

$$\begin{aligned}\Rightarrow 50 = \frac{2020 + 30f}{34 + f}\\[1em] \Rightarrow 50(34 + f) = 2020 + 30f\\[1em] \Rightarrow 1700 + 50f = 2020 + 30f\\[1em] \Rightarrow 50f - 30f = 2020 - 1700\\[1em] \Rightarrow 20f = 320\\[1em] \Rightarrow f = \frac{320}{20}\\[1em] \Rightarrow f = 16.\end{aligned}$$

Hence, the value of f = 16.

21Exercise 21.1

The mean of the following frequency distribution is 57.6 and the sum of all the frequencies is 50. Find the values of p and q :

ClassesFrequency
0 - 207
20 - 40p
40 - 6012
60 - 80q
80 - 1008
100 - 1205
Show SolutionHide Solution↓

We construct the following table :

Marks (Classes)Class mark (yi)Number of students (Frequency (fi))fiyi
0 - 2010770
20 - 4030p30p
40 - 605012600
60 - 8070q70q
80 - 100908720
100 - 1201105550
Total32 + p + q1940 + 30p + 70q

Given,

The sum of frequencies = 50.

∴ 32 + p + q = 50
⇒ p + q = 18
⇒ p = 18 - q      .....(i)

$$\begin{aligned}\therefore \text{Mean} = \frac{∑f_iy_i}{∑f_i} \\[1em] \Rightarrow 57.6 = \frac{1940 + 30p + 70q}{50} \\[1em] \Rightarrow 57.6 \times 50 = 1940 + 30p + 70q \\[1em] \Rightarrow 2880 = 1940 + 30p + 70q \\[1em] \Rightarrow 30p + 70q = 2880 - 1940 \\[1em] \Rightarrow 30p + 70q = 940\end{aligned}$$

Putting value of p from (i) in above equation,

$$\begin{aligned}\Rightarrow 30(18 - q) + 70q = 940 \\[1em] \Rightarrow 540 - 30q + 70q = 940 \\[1em] 540 + 40q = 940 \\[1em] 40q = 940 - 540 \\[1em] 40q = 400 \\[1em] q = 10\end{aligned}$$

Using (i),

⇒ p = 18 - q = 18 - 10 = 8.

Hence, the value of p = 8 and q = 10.

22Exercise 21.1

The following table gives the life time in days of 100 electricity tubes of a certain make :

Lifetime in daysNo. of tubes
less than 508
less than 10023
less than 15055
less than 20081
less than 25093
less than 300100

Find the mean lifetime of electricity tubes.

Show SolutionHide Solution↓

We construct the following table :

Lifetime in days
(Classes)
Class mark (yi)No. of tubes
(Cumulative frequency)
Frequency (fi)fiyi
0 - 502588200
50 - 100752323 - 8 = 151125
100 - 1501255555 - 23 = 324000
150 - 2001758181 - 55 = 264550
200 - 2502259393 - 81 = 122700
250 - 300275100100 - 93 = 71925
Total10014500

∴ Mean = $\frac{∑f_iy_i}{∑f_i} = \frac{14500}{100}$ = 145

Hence, mean of the following distribution is 145 days

23Exercise 21.1

The following table gives the duration of movies in minutes.

Duration (in minutes)No. of movies
100-1105
110-12010
120-13017
130-1408
140-1506
150-1605

Using step–deviation method, find the mean duration of the movies.

Show SolutionHide Solution↓

In the given table i is the class interval which is equal to 10.

ClassClass mark (x)d = (x - A)u = d/iFrequency (f)fu
100-110105-30-35-15
110-120115-20-210-20
120-130125-10-117-17
130-140A = 1350080
140-15014510166
150-160155202510
TotalΣf = 51Σfu = -36

Mean = A + $\frac{Σfu}{Σf} \times i = 135 + \frac{-36}{51} \times 10$

= $135 + \frac{-360}{51}$

= 135 - 7.06

= 127.94 (approx)

Hence, mean duration = 127.94 minutes (approx).

24Exercise 21.1

Shown below is a table illustrating the monthly income distribution in a company with 100 employees.

Monthly income (in ₹ 10,000)Number of employees
0-455
4-815
8-1206
12-1608
16-2012
20-244

Using step-deviation method, find the mean monthly income of an employee.

Show SolutionHide Solution↓

In the given table,

Class size (i) = 4.

Monthly incomeNo.of employees (f)Class markd = x - Au = d/ifu
0-4552-4-1-55
4-815A = 6000
8-1206104106
12-1608148216
16-20121812336
20-2442216416
TotalΣf = 100Σfu = 19

By formula,

Mean = A + $\frac{Σfu}{Σf} \times i$

= 6 + $\frac{19}{100} \times 4$

= 6 + $\frac{76}{100}$

= 6 + 0.76

= 6.76

Hence, mean = 6.76

25Exercise 21.1

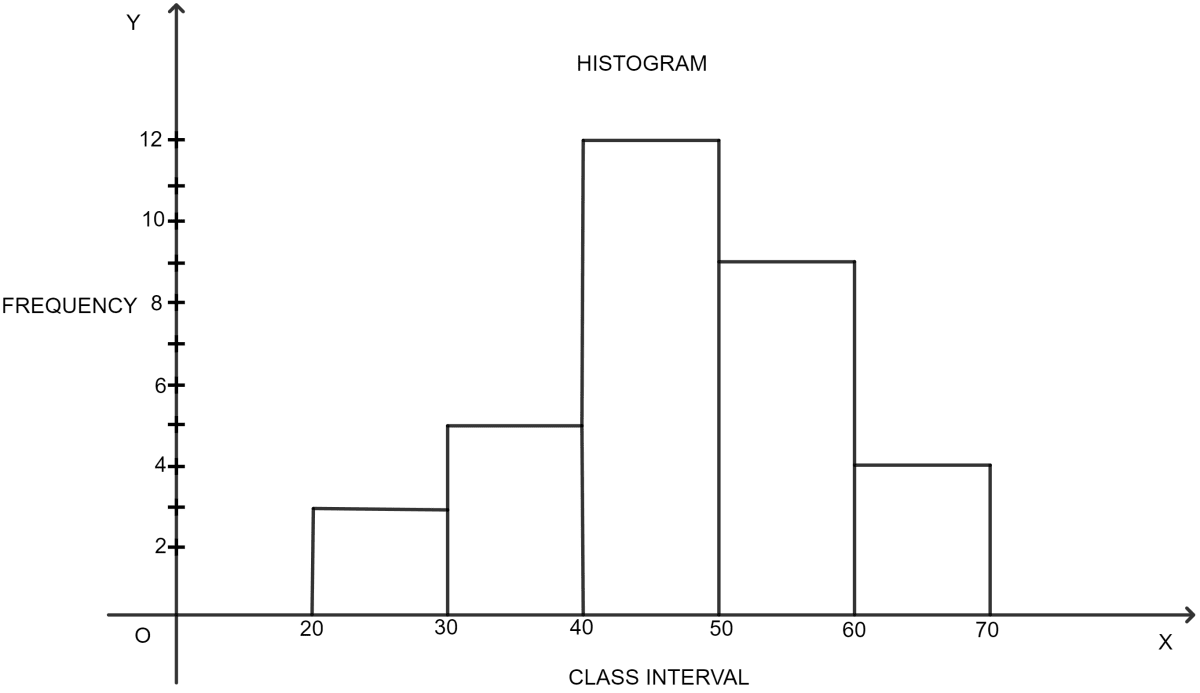
Using the information given in the adjoining histogram, calculate the mean correct to one decimal place.

Using the information given in the adjoining histogram, calculate the mean correct to one decimal place. Measures of Central Tendency, ML Aggarwal Understanding Mathematics Solutions ICSE Class 10.
Show SolutionHide Solution↓

We construct the following table :

Class intervalClass mark (yi)Frequency (fi)fiyi
20 - 3025375
30 - 40355175
40 - 504512540
50 - 60559495
60 - 70654260
Total331545

∴ Mean = $\frac{∑f_iy_i}{∑f_i} = \frac{1545}{33}$ = 46.8

Hence, mean of the following distribution is 46.8

1Exercise 21.2

A student scored the following marks in 11 questions of a question paper :

3, 4, 7, 2, 5, 6, 1, 8, 2, 5, 7.

Find the median marks.

Show SolutionHide Solution↓

On arranging the marks in ascending order, we get

1, 2, 2, 3, 4, 5, 5, 6, 7, 7, 8.

Here, n (no. of observations) = 11, which is odd.

$$\begin{aligned}\therefore \text{Median} = \frac{n + 1}{2} \text{th observation} \\[1em] = \frac{11 + 1}{2} \\[1em] = \frac{12}{2} \\[1em] = 6 \text{th observation}\end{aligned}$$

6th observation = 5.

Hence, the median marks are 5.

2Exercise 21.2

For the following set of numbers, find the median :

10, 75, 3, 81, 17, 27, 4, 48, 12, 47, 9, 15.

Show SolutionHide Solution↓

On arranging the numbers in ascending order we get,

3, 4, 9, 10, 12, 15, 17, 27, 47, 48, 75, 81.

Here, n (no. of observations) = 12, which is even.

$$\begin{aligned}\therefore \text{Median} = \frac{\frac{n}{2} \text{th observation} + \big(\frac{n}{2} + 1\big)\text{ th observation}}{2} \\[1em] = \frac{\frac{12}{2} \text{th observation} + \big(\frac{12}{2} + 1\big)\text{ th observation}}{2} \\[1em] = \frac{\text{ 6th observation + 7th observation}}{2} \\[1em] = \frac{15 + 17}{2} \\[1em] = \frac{32}{2} \\[1em] = 16.\end{aligned}$$

Hence, median = 16.

3Exercise 21.2

Calculate the mean and the median of the numbers : 2, 1, 0, 3, 1, 2, 3, 4, 3, 5.

Show SolutionHide Solution↓

On arranging the numbers in ascending order we get,

0, 1, 1, 2, 2, 3, 3, 3, 4, 5.

Sum of terms = 0 + 1 + 1 + 2 + 2 + 3 + 3 + 3 + 4 + 5 = 24.

By definition,

$$\begin{aligned}\text{Mean} = \frac{\text{Sum of terms}}{\text{No. of terms}} \\[1em] = \frac{24}{10} \\[1em] = 2.4\end{aligned}$$

Here, n (no. of observations) = 10, which is even.

$$\begin{aligned}\therefore \text{Median} = \frac{\frac{n}{2} \text{th observation} + \big(\frac{n}{2} + 1\big)\text{ th observation}}{2} \\[1em] = \frac{\frac{10}{2} \text{th observation} + \big(\frac{10}{2} + 1\big)\text{ th observation}}{2} \\[1em] = \frac{\text{ 5th observation + 6th observation}}{2} \\[1em] = \frac{2 + 3}{2} \\[1em] = \frac{5}{2} \\[1em] = 2.5\end{aligned}$$

Hence, mean = 2.4 and median = 2.5

4Exercise 21.2

The median of the observations 11, 12, 14, (x - 2), (x + 4), (x + 9), 32, 38, 47 arranged in ascending order is 24. Find the value of x and hence find the mean.

Show SolutionHide Solution↓

Observations arranged in ascending order are :

11, 12, 14, (x - 2), (x + 4), (x + 9), 32, 38, 47.

Here, n (no. of observations) = 9, which is odd.

$$\begin{aligned}\therefore \text{Median} = \frac{n + 1}{2} \text{th observation} \\[1em] = \frac{9 + 1}{2} \\[1em] = \frac{10}{2} \\[1em] = 5 \text{th observation}\end{aligned}$$

Given, median = 24 = 5th observation = x + 4.

⇒ 24 = x + 4
⇒ x = 24 - 4 = 20.

Putting the value of x in observations :

11, 12, 14, 18, 24, 29, 32, 38, 47.

Sum of terms = 11 + 12 + 14 + 18 + 24 + 29 + 32 + 38 + 47 = 225.

By definition,

$$\begin{aligned}\text{Mean } = \frac{\text{Sum of terms}}{\text{No. of terms}} \\[1em] = \frac{225}{9} \\[1em] = 25.\end{aligned}$$

Hence, the value of x = 20 and mean = 25.

5Exercise 21.2

The mean of the numbers 1, 7, 5, 3, 4, 4 is m. The numbers 3, 2, 4, 2, 3, 3, p have mean m - 1 and median q. Find (i) p (ii) q (iii) the mean of p and q.

Show SolutionHide Solution↓

(i) Given, the mean of the numbers 1, 7, 5, 3, 4, 4 is m.

Sum of terms = 1 + 7 + 5 + 3 + 4 + 4 = 24.

By definition,

$$\begin{aligned}\text{Mean } = \frac{\text{Sum of terms}}{\text{No. of terms}} \\[1em] \therefore \text{m} = \frac{24}{6} = 4.\end{aligned}$$

Given, the mean of the numbers 3, 2, 4, 2, 3, 3, p is (m - 1) i.e. 3.

Sum of terms = 3 + 2 + 4 + 2 + 3 + 3 + p = 17 + p.

By definition,

$$\begin{aligned}\text{Mean } = \frac{\text{Sum of terms}}{\text{No. of terms}} \\[1em] \therefore 3 = \frac{17 + p}{7} \\[1em] \Rightarrow 21 = p + 17 \\[1em] \Rightarrow p = 21 - 17 = 4.\end{aligned}$$

Hence, the value of p is 4.

(ii) Given, the median of the numbers 3, 2, 4, 2, 3, 3, 4 is q.

Arranging the numbers in ascending order we get,

2, 2, 3, 3, 3, 4, 4.

Here, n (no. of observations ) = 7, which is odd.

$$\begin{aligned}\therefore \text{Median} = \frac{n + 1}{2} \text{th observation} \\[1em] = \frac{7 + 1}{2} \\[1em] = \frac{8}{2} \\[1em] = 4 \text{th observation}\end{aligned}$$

Given, median = q = 4th observation = 3.

⇒ q = 3.

Hence, the value of q is 3.

(iii) Mean of p and q i.e. 4 and 3 is,

$$\begin{aligned}\text{Mean } = \frac{\text{Sum of terms}}{\text{No. of terms}} \\[1em] = \frac{4 + 3}{2} \\[1em] = \frac{7}{2} \\[1em] = 3.5\end{aligned}$$

Hence, mean of p and q is 3.5
6Exercise 21.2

Find the median for the following distribution:

Wages per day (in ₹)No. of workers
38014
4508
4807
55010
6206
6502
Show SolutionHide Solution↓

The given variates (wages) are already in ascending order. We construct the cumulative frequency table as under :

Wages per day (in ₹)Frequency (No. of workers)Cumulative frequency (fi)
3801414
450822
480729
5501039
620645
680247

Here, n (total no. of workers) = 47, which is odd.

$$\begin{aligned}\text{Median }= \Big(\frac{n + 1}{2}\Big)\text{th observation}\\[1em] = \Big(\frac{47 + 1}{2}\Big)\text{th observation}\\[1em] = \Big(\frac{48}{2}\Big)\text{th observation}\\[1em] = 24\text{th observation}\\[1em]\end{aligned}$$

All observations from 23rd to 29th are equal, each = 480.

Median = ₹480

Hence, median = ₹480.

7Exercise 21.2

Marks obtained by 70 students are given below :

MarksNo. of students
208
7012
5018
606
759
905
4012

Calculate the median marks.

Show SolutionHide Solution↓

On arranging the given variates (marks) in ascending order, we construct the cumulative frequency table as under :

Variate (Marks)Frequency (No. of students)Cumulative frequency
2088
401220
501838
60644
701256
75965
90570

Here, n (total no. of students) = 70, which is even.

$$\begin{aligned}\therefore \text{Median} = \frac{\frac{n}{2} \text{th observation} + \big(\frac{n}{2} + 1\big)\text{ th observation}}{2} \\[1em] = \frac{\frac{70}{2} \text{th observation} + \big(\frac{70}{2} + 1\big)\text{ th observation}}{2} \\[1em] = \frac{\text{ 35th observation + 36th observation}}{2} \\[1em]\end{aligned}$$

All observations from 21st to 38th are equal, each = 50.

Hence, median

$$\begin{aligned}= \frac{50 + 50}{2} \\[1em] = \frac{100}{2} \\[1em] = 50\end{aligned}$$

Hence, median marks = 50.

8Exercise 21.2

Calculate the mean and the median for the following distribution :

NumberFrequency
51
102
155
206
253
302
351
Show SolutionHide Solution↓

The given numbers are already in ascending order. We construct the cumulative frequency table as under :

Number (fi)Frequency (xi)Cumulative frequencyfixi
5115
102320
155875
20614120
2531775
3021960
3512035
Total20390

Here, n (no. of observations) = 20, which is even.

$$\begin{aligned}\therefore \text{Median} = \frac{\frac{n}{2} \text{th observation} + \big(\frac{n}{2} + 1\big)\text{ th observation}}{2} \\[1em] = \frac{\frac{20}{2} \text{th observation} + \big(\frac{20}{2} + 1\big)\text{ th observation}}{2} \\[1em] = \frac{\text{ 10th observation + 11th observation}}{2} \\[1em]\end{aligned}$$

All observations from 9th to 14th are equal, each = 20.

Hence, median

$$\begin{aligned}= \frac{20 + 20}{2} \\[1em] = \frac{40}{2} \\[1em] = 20.\end{aligned}$$

Now calculating mean,

$$\begin{aligned}\text{ Mean} = \frac{∑f_ix_i}{∑f_i} \\[1em] = \frac{390}{20} \\[1em] = 19.5\end{aligned}$$

Hence, mean = 19.5 and median = 20.

9Exercise 21.2

The daily output of 19 workers is:

41, 21, 38, 27, 31, 45, 23, 26, 29, 30, 28, 25, 35, 42, 47, 53, 29, 31, 35.

Find :

(i) the median

(ii) lower quartile

(iii) upper quartile

(iv) inter quartile range

Show SolutionHide Solution↓

On arranging the given wages in ascending order we get,

21, 23, 25, 26, 27, 28, 29, 29, 30, 31, 31, 35, 35, 38, 41, 42, 45, 47, 53.

Here, n (no. of observations) = 19, which is odd.

(i) As n is odd,

$$\begin{aligned}\therefore \text{Median} = \frac{n + 1}{2} \text{th observation} \\[1em] = \frac{19 + 1}{2} \\[1em] = \frac{20}{2} \\[1em] = 10 \text{th observation}\end{aligned}$$

∴ Median = 10th observation = 31.

Hence, median = 31.

(ii) As n is odd,

$$\begin{aligned}\therefore \text{Lower quartile} (Q_1) = \frac{n + 1}{4} \text{th observation} \\[1em] = \frac{19 + 1}{4} \\[1em] = \frac{20}{4} \\[1em] = 5 \text{th observation}\end{aligned}$$

∴ Lower quartile (Q1) = 5th observation = 27.

Hence, lower quartile = 27.

(iii) As n is odd,

$$\begin{aligned}\therefore \text{Upper quartile} (Q_3) = \frac{3(n + 1)}{4} \text{th observation} \\[1em] = \frac{3(19 + 1)}{4} \\[1em] = \frac{60}{4} \\[1em] = 15 \text{th observation}\end{aligned}$$

∴ Upper quartile (Q3) = 15th observation = 41.

Hence, upper quartile = 41.

(iv) Inter quartile range = Q3 - Q1 = 41 - 27 = 14.

Hence, inter quartile range = 14.

10Exercise 21.2

From the following frequency distribution, find :

(i) the median

(ii) lower quartile

(iii) upper quartile

(iv) inter quartile range

VariateFrequency
154
186
208
229
257
278
306
Show SolutionHide Solution↓

The given variates are already in ascending order. We construct the cumulative frequency table as under

VariateFrequencyCumulative frequency
1544
18610
20818
22927
25734
27842
30648

Here, n (no. of observations) = 48, which is even.

(i) As n is even,

$$\begin{aligned}\therefore \text{Median} = \frac{\frac{n}{2} \text{th observation} + \big(\frac{n}{2} + 1\big)\text{ th observation}}{2} \\[1em] = \frac{\frac{48}{2} \text{th observation} + \big(\frac{48}{2} + 1\big)\text{ th observation}}{2} \\[1em] = \frac{\text{ 24th observation + 25th observation}}{2} \\[1em]\end{aligned}$$

All observations from 19th to 27th are equal, each = 22.

Hence, median

$$\begin{aligned}= \frac{22 + 22}{2} \\[1em] = \frac{44}{2} \\[1em] = 22.\end{aligned}$$

Hence, median = 22.

(ii) As n is even,

$$\begin{aligned}\therefore \text{Lower quartile} (Q_1) = \frac{n}{4} \text{th observation} \\[1em] = \frac{48}{4} \\[1em] = 12 \text{th observation}\end{aligned}$$

∴ Lower quartile (Q1) = 12th observation = 20.

Hence, lower quartile = 20.

(iii) As n is even,

$$\begin{aligned}\therefore \text{Upper quartile} (Q_3) = \frac{3n}{4} \text{th observation} \\[1em] = \frac{3 × 48}{4} \\[1em] = \frac{144}{4} \\[1em] = 36 \text{th observation}\end{aligned}$$

∴ Upper quartile (Q3) = 36th observation = 27.

Hence, upper quartile = 27.

(iv) Inter quartile range = Q3 - Q1 = 27 - 20 = 7.

Hence, inter quartile range = 7.

11Exercise 21.2

For the following frequency distribution, find :

(i) the median

(ii) lower quartile

(iii) upper quartile

VariateFrequency
253
318
3410
4015
4510
489
506
602
Show SolutionHide Solution↓

The given numbers are already in ascending order. We construct the cumulative frequency table as under

VariateFrequencyCumulative frequency
2533
31811
341021
401536
451046
48955
50661
60263

Here, n (no. of observations) = 63, which is odd.

(i) As n is odd,

$$\begin{aligned}\therefore \text{Median} = \frac{n + 1}{2} \text{th observation} \\[1em] = \frac{63 + 1}{2} \\[1em] = \frac{64}{2} \\[1em] = 32 \text{nd observation}\end{aligned}$$

∴ Median = 32nd observation = 40.

Hence, median = 40.

(ii) As n is odd,

$$\begin{aligned}\therefore \text{Lower quartile} (Q_1) = \frac{n + 1}{4} \text{th observation} \\[1em] = \frac{63 + 1}{4} \\[1em] = \frac{64}{4} \\[1em] = 16 \text{th observation}\end{aligned}$$

∴ Lower quartile (Q1) = 16th observation = 34.

Hence, lower quartile = 34.

(iii) As n is odd,

$$\begin{aligned}\therefore \text{Upper quartile} (Q_3) = \frac{3(n + 1)}{4} \text{th observation} \\[1em] = \frac{3(63 + 1)}{4} \\[1em] = \frac{3 \times 64}{4} \\[1em] = 48 \text{th observation}\end{aligned}$$

∴ Upper quartile (Q3) = 48th observation = 48.

Hence, upper quartile = 48.

1Exercise 21.3

Find the mode of the following sets of numbers :

(i) 5, 7, 6, 8, 9, 0, 6, 8, 1, 8

(ii) 9, 0, 2, 8, 5, 3, 5, 4, 1, 5, 2, 7

Show SolutionHide Solution↓

(i) In the given data : 5, 7, 6, 8, 9, 0, 6, 8, 1, 8

8 is repeated more number of times than any other number,

∴ mode = 8.

(ii) In the given data : 9, 0, 2, 8, 5, 3, 5, 4, 1, 5, 2, 7

5 is repeated more number of times than any other number,

∴ mode = 5.

2Exercise 21.3

Find the mean, median and mode of the following distribution :

8, 10, 7, 6, 10, 11, 6, 13, 10.

Show SolutionHide Solution↓

Arithmetic mean (A.M.) = $\frac{\text{Sum of terms}}{\text{No.of terms}} = \frac{∑x_i}{n}$

Sum of terms = 8 + 10 + 7 + 6 + 10 + 11 + 6 + 13 + 10 = 81.

$\therefore \text{A.M.} = \frac{81}{9} = 9.$

∴ Mean = 9.

On arranging the marks in ascending order, we get

6, 6, 7, 8, 10, 10, 10, 11, 13.

Here, n (no. of observations) = 9, which is odd.

$$\begin{aligned}\therefore \text{Median} = \frac{n + 1}{2} \text{th observation} \\[1em] = \frac{9 + 1}{2} \\[1em] = \frac{10}{2} \\[1em] = 5 \text{th observation}\end{aligned}$$

5th observation = 10.

∴ Median = 10.

In the given data : 8, 10, 7, 6, 10, 11, 6, 13, 10

10 is repeated more number of times than any other number,

∴ Mode = 10.

Hence, mean = 9, median = 10 and mode = 10.

3Exercise 21.3

Calculate the mean, median and the mode of the following numbers :

3, 1, 5, 6, 3, 4, 5, 3, 7, 2.

Show SolutionHide Solution↓

Arithmetic mean (A.M.) = $\frac{\text{Sum of terms}}{\text{No.of terms}} = \frac{∑x_i}{n}$

Sum of terms = 3 + 1 + 5 + 6 + 3 + 4 + 5 + 3 + 7 + 2 = 39

$\therefore \text{A.M.} = \frac{39}{10} = 3.9$

∴ Mean = 3.9

On arranging the numbers in ascending order we get,

1, 2, 3, 3, 3, 4, 5, 5, 6, 7.

Here, n (no. of observations) = 10, which is even.

$$\begin{aligned}\therefore \text{Median} = \frac{\frac{n}{2} \text{th observation} + \big(\frac{n}{2} + 1\big)\text{ th observation}}{2} \\[1em] = \frac{\frac{10}{2} \text{th observation} + \big(\frac{10}{2} + 1\big)\text{ th observation}}{2} \\[1em] = \frac{\text{5th observation + 6th observation}}{2} \\[1em] = \frac{3 + 4}{2} \\[1em] = \frac{7}{2} \\[1em] = 3.5\end{aligned}$$

∴ Median = 3.5

In the given data : 3, 1, 5, 6, 3, 4, 5, 3, 7, 2.

3 is repeated more number of times than any other number,

∴ Mode = 3.

Hence, mean = 3.9, median = 3.5 and mode = 3.

4Exercise 21.3

The marks of 10 students of a class in an examination arranged in ascending order are as follows :

13, 35, 43, 46, x, x + 4, 55, 61, 71, 80.

If the median marks is 48, find the value of x. Hence, find the mode of the given data.

Show SolutionHide Solution↓

Here, n (no. of observations) = 10, which is even.

$$\begin{aligned}\therefore \text{Median} = \frac{\frac{n}{2} \text{th observation} + \big(\frac{n}{2} + 1\big)\text{ th observation}}{2} \\[1em] = \frac{\frac{10}{2} \text{th observation} + \big(\frac{10}{2} + 1\big)\text{ th observation}}{2} \\[1em] = \frac{\text{5th observation + 6th observation}}{2} \\[1em] = \frac{x + (x + 4)}{2} \\[1em] = \frac{2x + 4}{2} \\[1em] = x + 2.\end{aligned}$$

Given, median marks = 48.

∴ x + 2 = 48
⇒ x = 46.

Putting value of x in data we get,

13, 35, 43, 46, 46, 50, 55, 61, 71, 80.

In the given data 46 is repeated more number of times than any other number.

Hence, the value of x = 46 and mode = 46.

5Exercise 21.3

Find the mode and median of the following frequency distribution :

xf
101
114
127
135
149
153
Show SolutionHide Solution↓

The variates are already in ascending order. We construct the cumulative frequency table as under :

xfCumulative frequency (C.F.)
1011
1145
12712
13517
14926
15329

Total number of observations = 29, which is odd.

$$\begin{aligned}\therefore \text{Median} = \frac{n + 1}{2} \text{th observation} \\[1em] = \frac{29 + 1}{2} \\[1em] = \frac{30}{2} \\[1em] = 15 \text{th observation}\end{aligned}$$

All observations from 13th to 17th are equal, each = 13, so median = 13.

As the variate 14 has maximum frequency 9, so mode = 14.

Hence, median = 13 and mode = 14.

6Exercise 21.3

In a class of 40 students marks obtained by the students in a class test (out of 10) are given below :

MarksNumber of students
11
22
33
43
56
610
75
84
93
103

Calculate the following for the given distribution :

(i) median

(ii) mode.

Show SolutionHide Solution↓

(i) The variates are already in ascending order. We construct the cumulative frequency table as under :

MarksNumber of studentsCumulative frequency (C.F.)
111
223
336
439
5615
61025
7530
8434
9337
10340

Total number of observations = 40, which is even.

$$\begin{aligned}\therefore \text{Median} = \frac{\frac{n}{2} \text{th observation} + \big(\frac{n}{2} + 1\big)\text{th observation}}{2} \\[1em] = \frac{\frac{40}{2} \text{th observation} + \big(\frac{40}{2} + 1\big)\text{th observation}}{2} \\[1em] = \frac{\text{ 20th observation + 21st observation}}{2} \\[1em]\end{aligned}$$

All observations from 16th to 25th are equal, each = 6.

Hence, median

$$\begin{aligned}= \frac{6 + 6}{2} \\[1em] = \frac{12}{2} \\[1em] = 6.\end{aligned}$$

Hence, median = 6.

(ii) As the variate 6 has maximum frequency 10, so mode = 6.

Hence, mode = 6.

7Exercise 21.3

The marks obtained by 30 students in a class assessment of 5 marks is given below :

MarksNo. of students
01
13
26
310
45
55

Calculate the mean, median and mode of the above distribution.

Show SolutionHide Solution↓

The variates (marks) are already in ascending order. We construct the cumulative frequency table as under :

Marks (xi)No. of students (fi)Cumulative frequency (C.F.)fixi
0110
1343
261012
3102030
452520
553025
Total3090

Mean = $\frac{∑f_ix_i}{∑f_i} = \frac{90}{30}$ = 3.

Total number of observations = 30, which is even.

$$\begin{aligned}\therefore \text{Median} = \frac{\frac{n}{2} \text{th observation} + \big(\frac{n}{2} + 1\big)\text{th observation}}{2} \\[1em] = \frac{\frac{30}{2} \text{th observation} + \big(\frac{30}{2} + 1\big)\text{ th observation}}{2} \\[1em] = \frac{\text{ 15th observation + 16th observation}}{2} \\[1em]\end{aligned}$$

All observations from 11th to 20th are equal, each = 3.

Hence, median

$$\begin{aligned}= \frac{3 + 3}{2} \\[1em] = \frac{6}{2} \\[1em] = 3.\end{aligned}$$

As the variate 3 has maximum frequency 10, so mode = 3.

Hence, mean = 3, median = 3 and mode = 3.

8Exercise 21.3

The distribution table given below shows the marks obtained by 25 students in an aptitude test. Find the mean, median and mode of the distribution.

Marks obtainedNo. of students
53
69
76
84
92
101
Show SolutionHide Solution↓

The variates (marks) are already in ascending order. We construct the cumulative frequency table as under :

Marks (xi)No. of students (fi)Cumulative frequency (C.F.)fixi
53315
691254
761842
842232
922418
1012510
Total25171

Mean = $\frac{∑f_ix_i}{∑f_i} = \frac{171}{25}$ = 6.84.

Total number of observations = 25, which is odd.

$$\begin{aligned}\therefore \text{Median} = \frac{n + 1}{2} \text{th observation} \\[1em] = \frac{25 + 1}{2} \\[1em] = \frac{26}{2} \\[1em] = 13 \text{th observation}\end{aligned}$$

All observations from 13th to 18th are equal, each = 7, so median = 7.

As the variate 6 has maximum frequency 9, so mode = 6.

Hence, mean = 6.84, median = 7 and mode = 6.

9Exercise 21.3

The following table gives the weekly wages (in ₹) of workers in a factory:

Weekly wages (in ₹)No. of workers
500 - 5505
550 - 60020
600 - 65010
650 - 70010
700 - 7509
750 - 8006
800 - 85012
850 - 9008

Calculate:

(i) the mean.

(ii) the modal class.

(iii) the number of workers getting weekly wages below ₹800

(iv) the number of workers getting ₹650 or more but less than ₹850 as weekly wages.

Show SolutionHide Solution↓

(i) We construct the following table :

Weekly wages (xi)No. of workers (fi)Class mark (ui)Cumulative frequency (C.F.)fi.ui
500 - 550552552625
550 - 600205752511500
600 - 65010625356250
650 - 70010675456750
700 - 7509725546525
750 - 8006775604650
800 - 85012825729900
850 - 9008875807000
TotalΣfi = 80Σfiui = 55200

By formula,

$$\begin{aligned}\text{Mean }= \frac{∑f_iu_i}{∑f_i}\\[1em] = \frac{55200}{80}\\[1em] = 690.\end{aligned}$$

Hence, mean = ₹ 690.

(ii) The class 550 - 600 has maximum frequency 20.

Hence, modal class = 550-600.

(iii) From table,

The number of workers getting weekly wages below ₹800 = 60.

(iv) From table,

The number of workers getting ₹650 or more but less than ₹850 as weekly wages = 72 - 35 = 37.

1Exercise 21.4

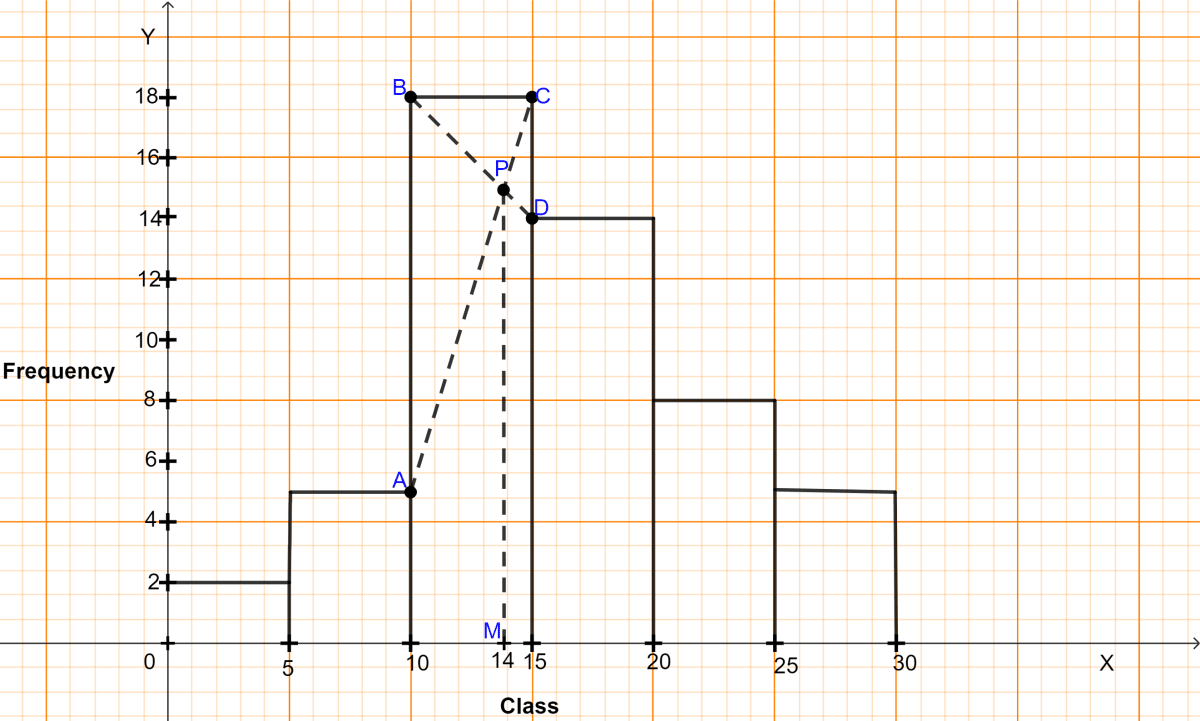
Draw a histogram for the following frequency distribution and find the mode from the graph :

ClassFrequency
0 - 52
5 - 105
10 - 1518
15 - 2014
20 - 258
25 - 305
Show SolutionHide Solution↓

Steps :

  1. Take 1 cm along x-axis = 5 units and 1 cm along y-axis = 4 units.
  2. Construct rectangles corresponding to the given data.
  3. In highest rectangle, draw two st. lines AC and BD from corners of the rectangles on either side of the highest rectangle to the opposite corners of the highest rectangle. Let P be the point of intersection of AC and BD.
  4. Through P, draw a vertical line to meet the x-axis at M. The abscissa of the point M represents 14.
Draw a histogram for the following frequency distribution and find the mode from the graph. Measures of Central Tendency, ML Aggarwal Understanding Mathematics Solutions ICSE Class 10.

Hence, the required mode = 14.

2Exercise 21.4

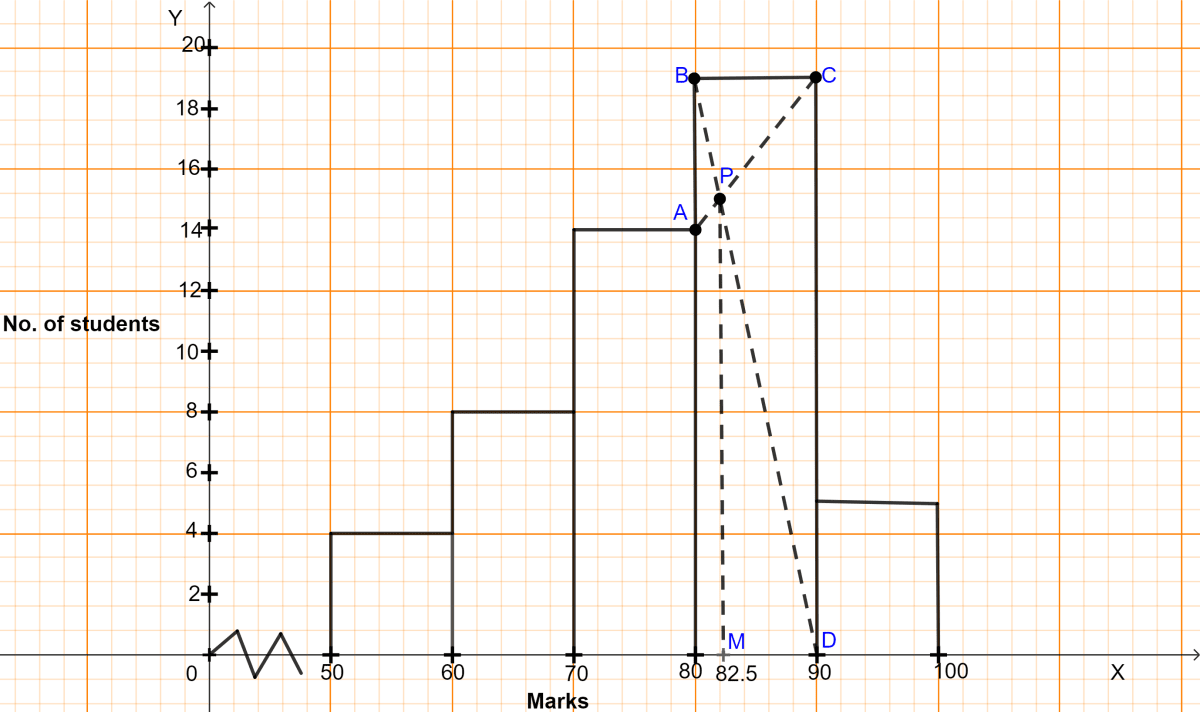
A mathematics aptitude test of 50 students was recorded as follows :

MarksNo. of students
50 - 604
60 - 708
70 - 8014
80 - 9019
90 - 1005

Draw a histogram for the above data using a graph paper and locate the mode.

Show SolutionHide Solution↓

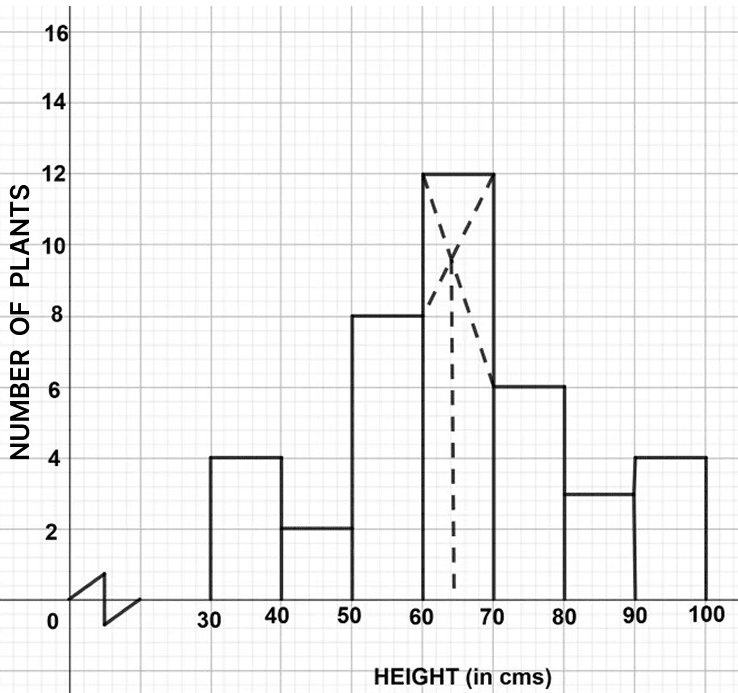
Steps :

  1. Take 1 cm along x-axis = 10 marks and 1 cm along y-axis = 4 (students).
  2. Since, the scale on x-axis starts at 50, a break (zig-zag curve) is shown near the origin along x-axis to indicate that the graph is drawn to scale beginning at 50 and not at origin itself.
  3. Construct rectangles corresponding to the given data.
  4. In highest rectangle, draw two st. lines AC and BD from corners of the rectangles on either side of the highest rectangle to the opposite corners of the highest rectangle. Let P be the point of intersection of AC and BD.
  5. Through P, draw a vertical line to meet the x-axis at M. The abscissa of the point M represents 82.5.
A mathematics aptitude test of 50 students was recorded as follows. Draw a histogram for the above data using a graph paper and locate the mode. Measures of Central Tendency, ML Aggarwal Understanding Mathematics Solutions ICSE Class 10.

Hence, the required mode = 82.5

3Exercise 21.4

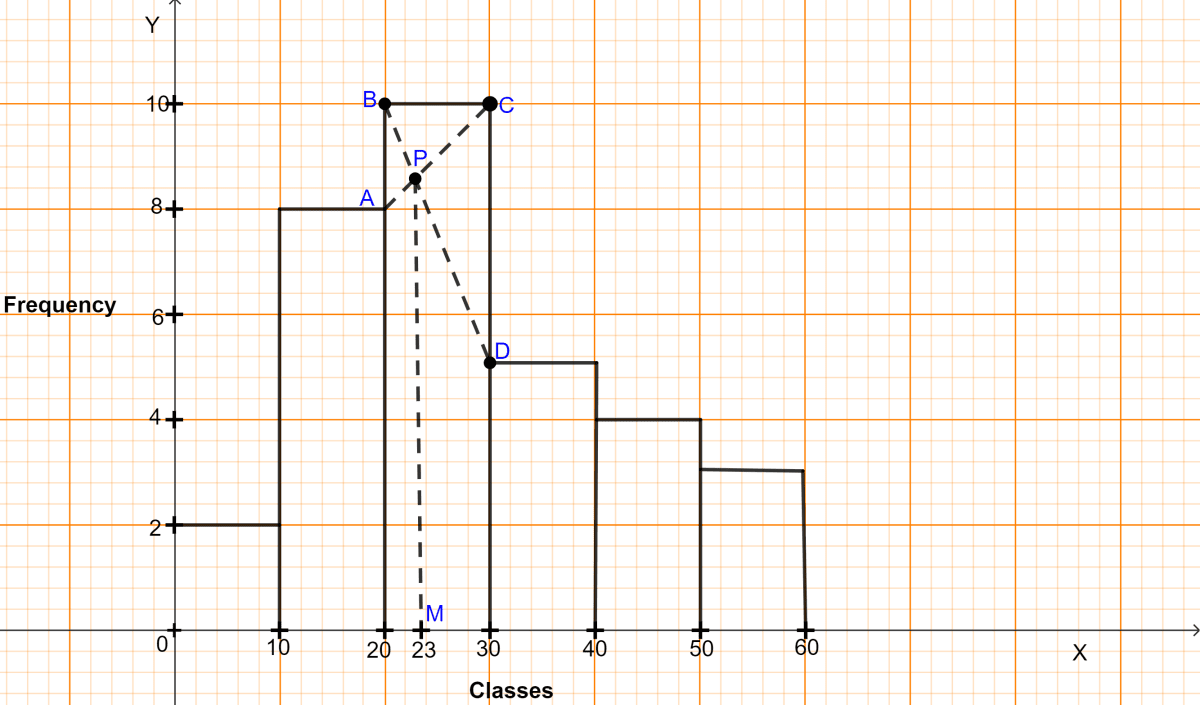
Draw a histogram and estimate the mode for the following frequency distribution :

ClassesFrequency
0 - 102
10 - 208
20 - 3010
30 - 405
40 - 504
50 - 603
Show SolutionHide Solution↓

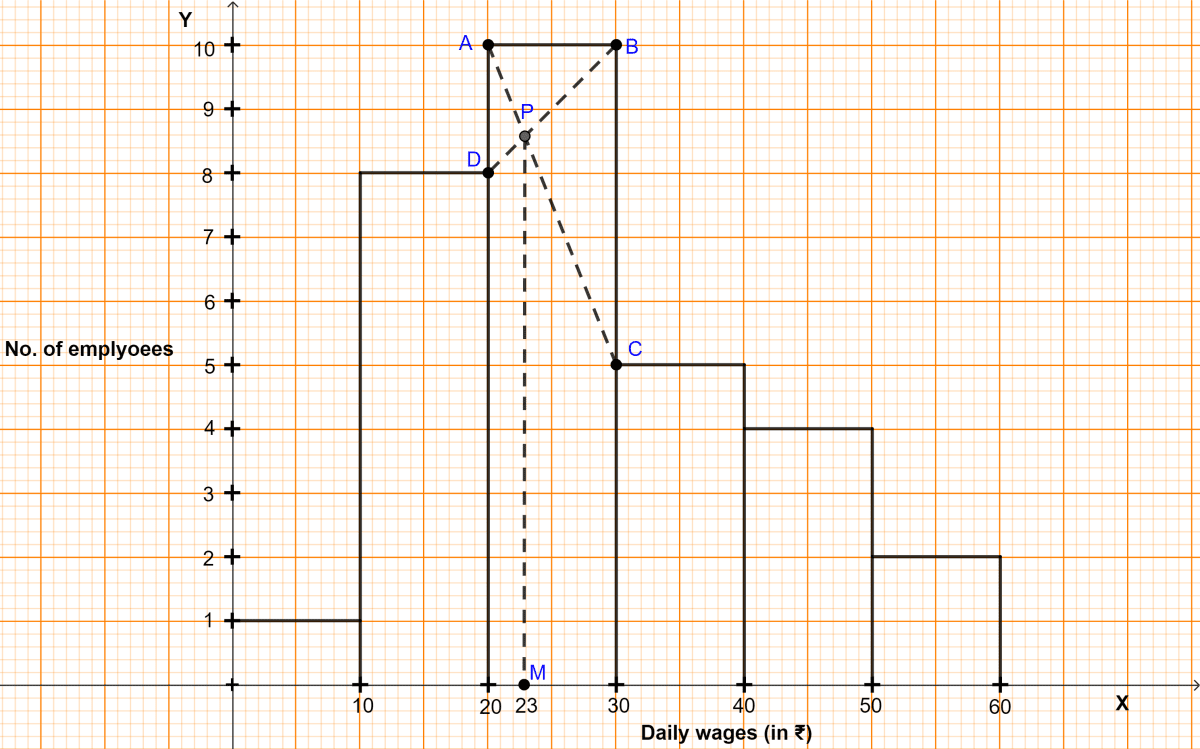
Steps :

  1. Take 1 cm along x-axis = 10 units and 1 cm along y-axis = 2 units.
  2. Construct rectangles corresponding to the given data.
  3. In highest rectangle, draw two st. lines AC and BD from corners of the rectangles on either side of the highest rectangle to the opposite corners of the highest rectangle. Let P be the point of intersection of AC and BD.
  4. Through P, draw a vertical line to meet the x-axis at M. The abscissa of the point M represents 23.
Draw a histogram and estimate the mode for the following frequency distribution. Measures of Central Tendency, ML Aggarwal Understanding Mathematics Solutions ICSE Class 10.

Hence, the required mode = 23.

4Exercise 21.4

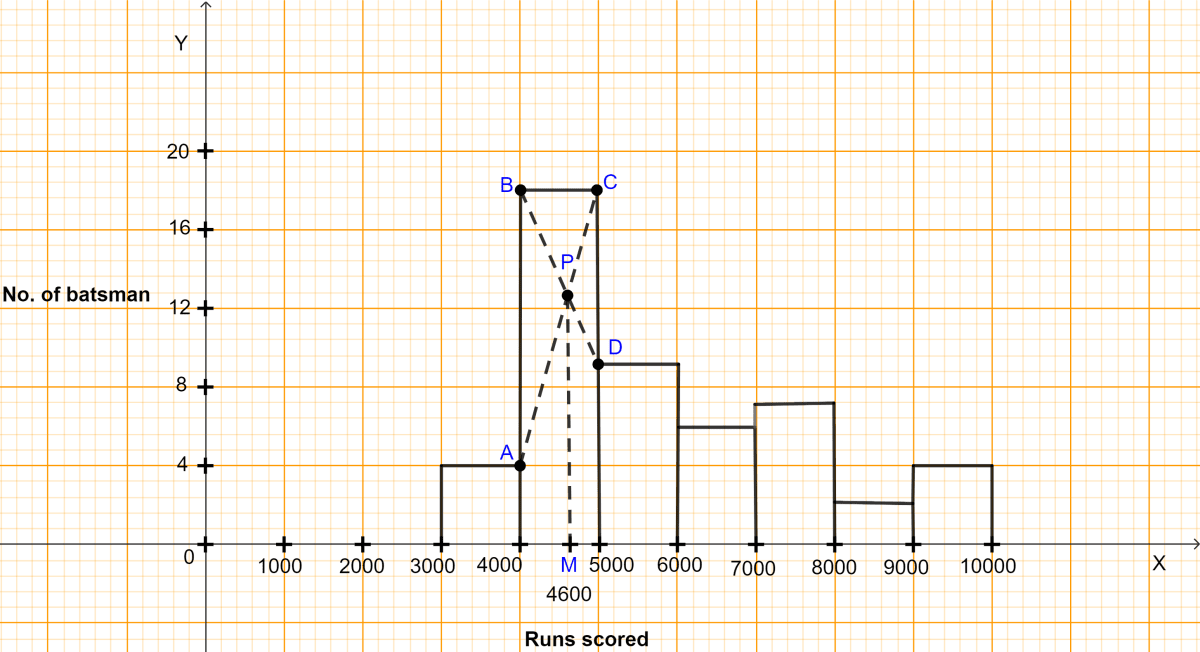
Using a graph paper, draw a histogram for the given distribution showing the number of runs scored by 50 batsmen. Estimate the mode of the data :

Runs scoredNo. of batsmen
3000 - 40004
4000 - 500018
5000 - 60009
6000 - 70006
7000 - 80007
8000 - 90002
9000 - 100004
Show SolutionHide Solution↓

Steps :

  1. Take 1 cm along x-axis = 1000 runs and 1 cm along y-axis = 4 (batsman).
  2. Construct rectangles corresponding to the given data.
  3. In highest rectangle, draw two st. lines AC and BD from corners of the rectangles on either side of the highest rectangle to the opposite corners of the highest rectangle. Let P be the point of intersection of AC and BD.
  4. Through P, draw a vertical line to meet the x-axis at M. The abscissa of the point M represents 4600.
Using a graph paper, draw a histogram for the given distribution showing the number of runs scored by 50 batsmen. Estimate the mode of the data. Measures of Central Tendency, ML Aggarwal Understanding Mathematics Solutions ICSE Class 10.

Hence, the required mode = 4600.

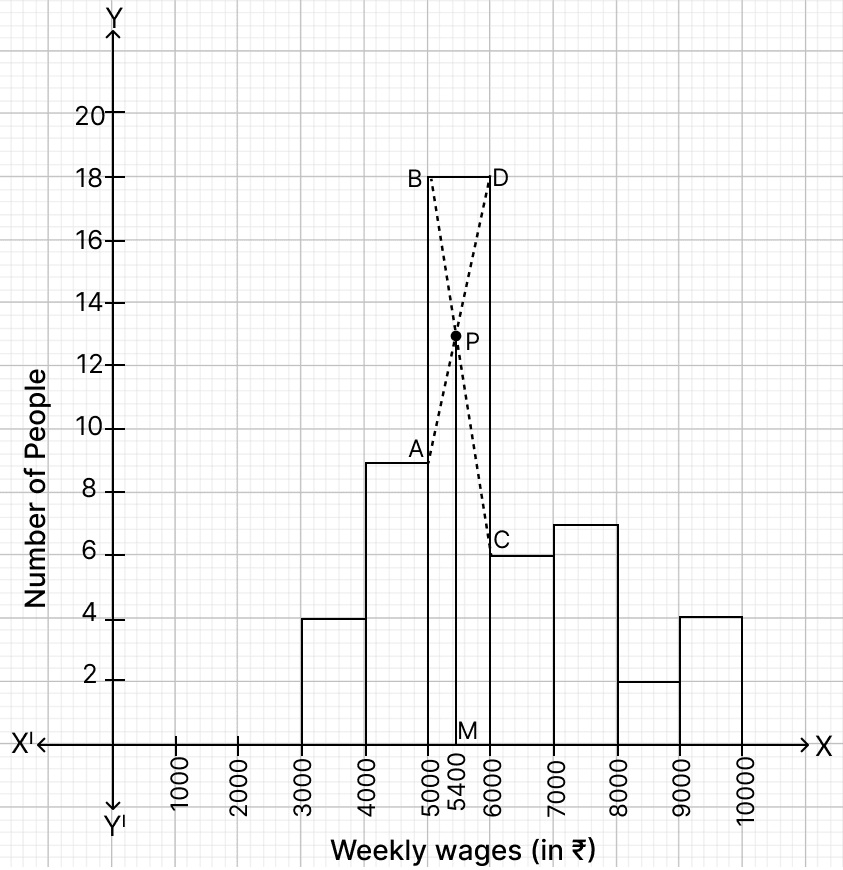
5Exercise 21.4

Draw a histogram for the given data, using a graph paper:

Weekly Wages (in ₹)No. of people
3000 - 40004
4000 - 50009
5000 - 600018
6000 - 70006
7000 - 80007
8000 - 90002
9000 - 100004

Estimate the mode from the graph.

Show SolutionHide Solution↓

Steps :

  1. Take 1 cm along x-axis = 1000 rupees and 1 cm along y-axis = 2 (No. of people).

  2. Construct rectangles corresponding to the given data.

  3. In highest rectangle, draw two st. lines AD and BC from corners of the rectangles on either side of the highest rectangle to the opposite corners of the highest rectangle. Let P be the point of intersection of AD and BC.

  4. Through P, draw a vertical line to meet the x-axis at M. The abscissa of the point M represents 5400.

Draw a histogram for the given data, using a graph paper: Measures of Central Tendency, ML Aggarwal Understanding Mathematics Solutions ICSE Class 10.

Hence, mode = ₹ 5,400.

6Exercise 21.4

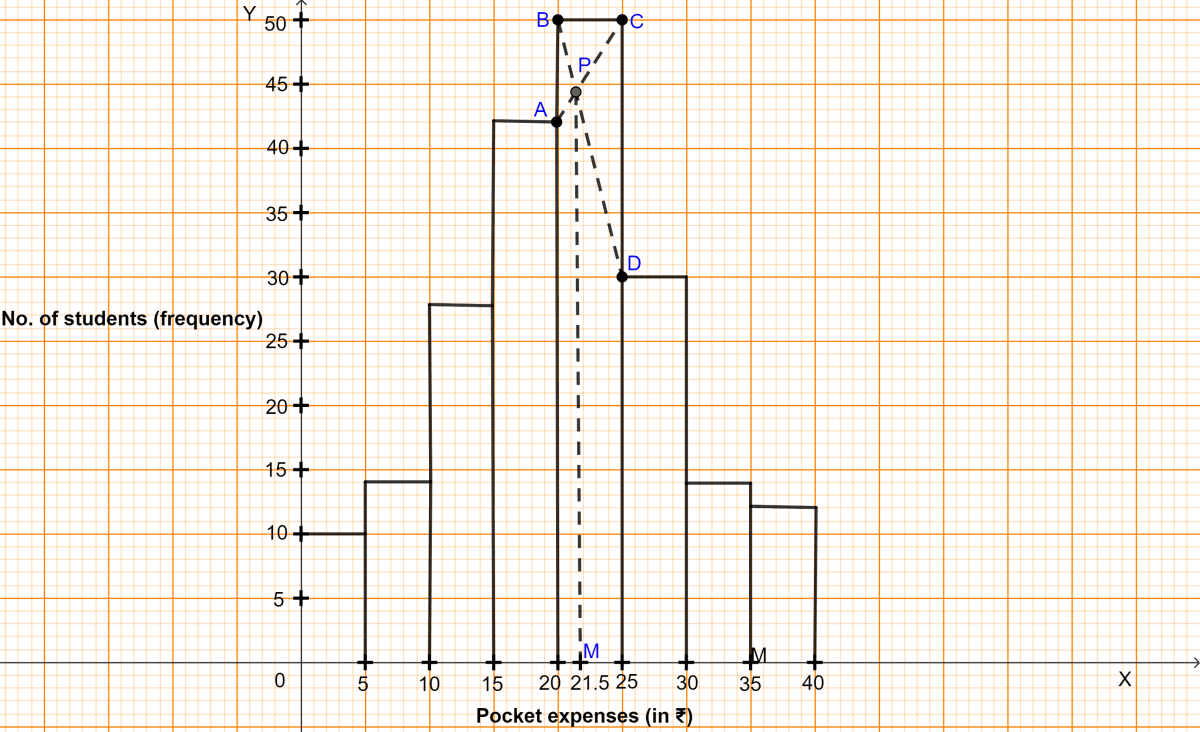
Use a graph paper for this question. The daily pocket expenses of 200 students in a school are given below :

Pocket expenses
(in ₹)
No. of students
(frequency)
0 - 510
5 - 1014
10 - 1528
15 - 2042
20 - 2550
25 - 3030
30 - 3514
35 - 4012

Draw a histogram representing the above distribution and estimate the mode from the graph.

Show SolutionHide Solution↓

Steps :

  1. Take 1 cm along x-axis = ₹5 and 1 cm along y-axis = 5 students.
  2. Construct rectangles corresponding to the given data.
  3. In highest rectangle, draw two st. lines AC and BD from corners of the rectangles on either side of the highest rectangle to the opposite corners of the highest rectangle. Let P be the point of intersection of AC and BD.
  4. Through P, draw a vertical line to meet the x-axis at M. The abscissa of the point M represents ₹21.50.
Use a graph paper for this question. The daily pocket expenses of 200 students in a school are given below. Draw a histogram representing the above distribution and estimate the mode from the graph. Measures of Central Tendency, ML Aggarwal Understanding Mathematics Solutions ICSE Class 10.

Hence, the required mode = ₹21.50.

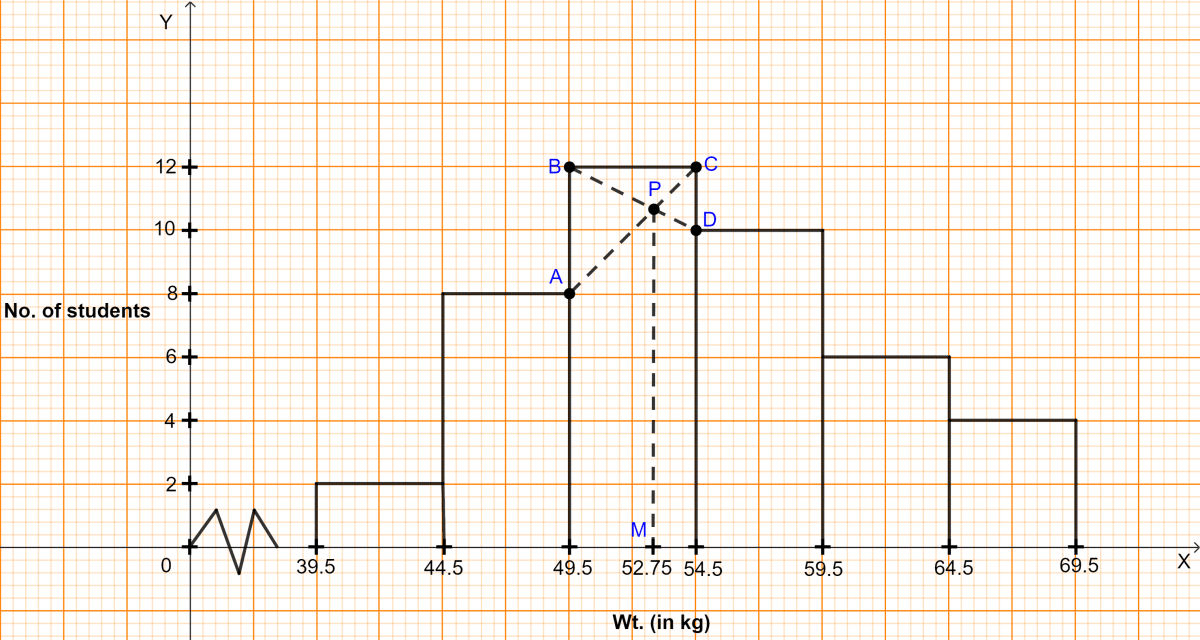
7Exercise 21.4

Draw a histogram for the following distribution :

Wt. (in kg)No. of students
40 - 442
45 - 498
50 - 5412
55 - 5910
60 - 646
65 - 694

Hence, estimate the modal weight.

Show SolutionHide Solution↓

Steps :

  1. The given frequency distribution is discontinuous, to convert it into continuous distribution,

     Adjustment factor = $\frac{45 - 44}{2} = \frac{1}{2}$ = 0.5

We construct the continuous frequency table for the given data :

Classes before adjustmentClasses after adjustmentNo. of students
40 - 4439.5 - 44.52
45 - 4944.5 - 49.58
50 - 5449.5 - 54.512
55 - 5954.5 - 59.510
60 - 6459.5 - 64.56
65 - 6964.5 - 69.54
  1. Take 2 cm along x-axis = 5 kg and 1 cm along y-axis = 2 (students).

  2. Since, the scale on x-axis starts at 39.5, a break (zig-zag curve) is shown near the origin along x-axis to indicate that the graph is drawn to scale beginning at 39.5 and not at origin itself.

  3. Construct rectangles corresponding to the given data.

  4. In highest rectangle, draw two st. lines AC and BD from corners of the rectangles on either side of the highest rectangle to the opposite corners of the highest rectangle. Let P be the point of intersection of AC and BD.

  5. Through P, draw a vertical line to meet the x-axis at M. The abscissa of the point M represents 52.75 kg.

Draw a histogram for the following distribution. Hence, estimate the modal weight. Measures of Central Tendency, ML Aggarwal Understanding Mathematics Solutions ICSE Class 10.

Hence, the required mode = 52.75 kg.

8Exercise 21.4

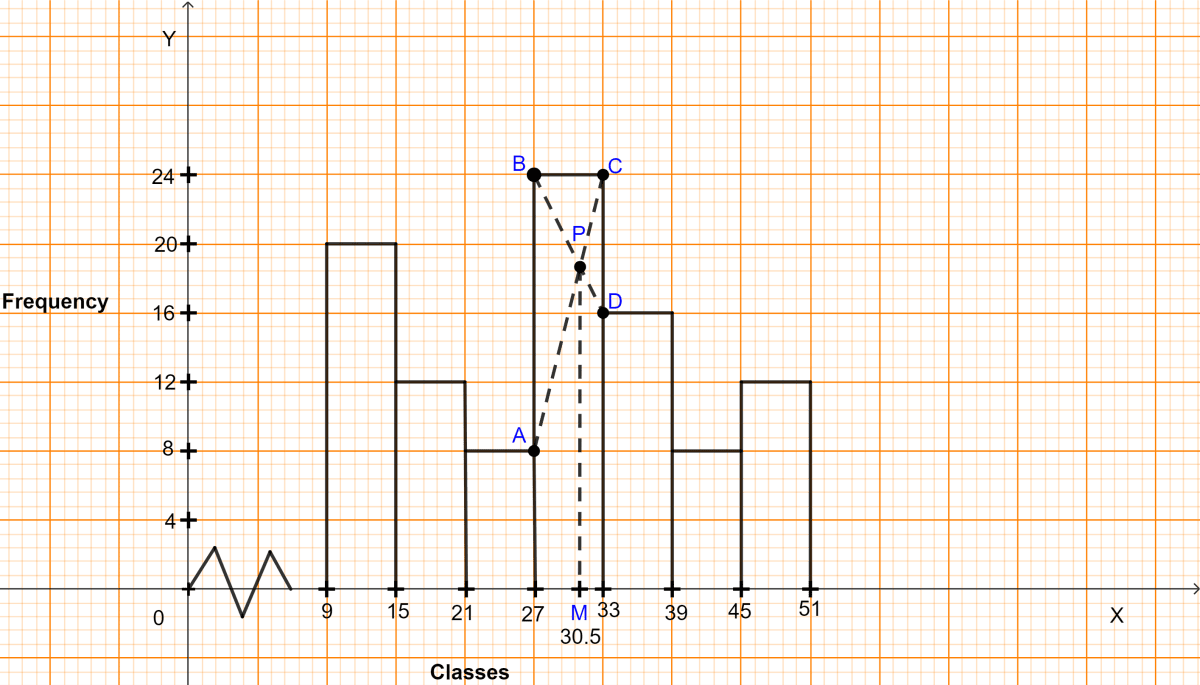
Find the mode of the following distribution by drawing a histogram.

Mid valueFrequency
1220
1812
248
3024
3616
428
4812

Also state the modal class.

Show SolutionHide Solution↓

Size of each class = difference between two consecutive mid-values = 18 - 12 = 6.

Constructing the table as under :

Mid valueClassFrequency
129 - 1520
1815 - 2112
2421 - 278
3027 - 3324
3633 - 3916
4239 - 458
4845 - 5112

Steps :

  1. Take 1 cm along x-axis = 6 units and 1 cm along y-axis = 4 units.

  2. Since, the scale on x-axis starts at 9, a break (zig-zag curve) is shown near the origin along x-axis to indicate that the graph is drawn to scale beginning at 9 and not at origin itself.

  3. Construct rectangles corresponding to the given data.

  4. In highest rectangle, draw two st. lines AC and BD from corners of the rectangles on either side of the highest rectangle to the opposite corners of the highest rectangle. Let P be the point of intersection of AC and BD.

  5. Through P, draw a vertical line to meet the x-axis at M. The abscissa of the point M represents 30.5.

∴ Mode = 30.5

As the class 27 - 33 has the highest frequency, hence modal class = 27 - 33.

Find the mode of the following distribution by drawing a histogram. Also state the modal class. Measures of Central Tendency, ML Aggarwal Understanding Mathematics Solutions ICSE Class 10.

Hence, the required mode = 30.5 and modal class = 27 - 33.

9Exercise 21.4

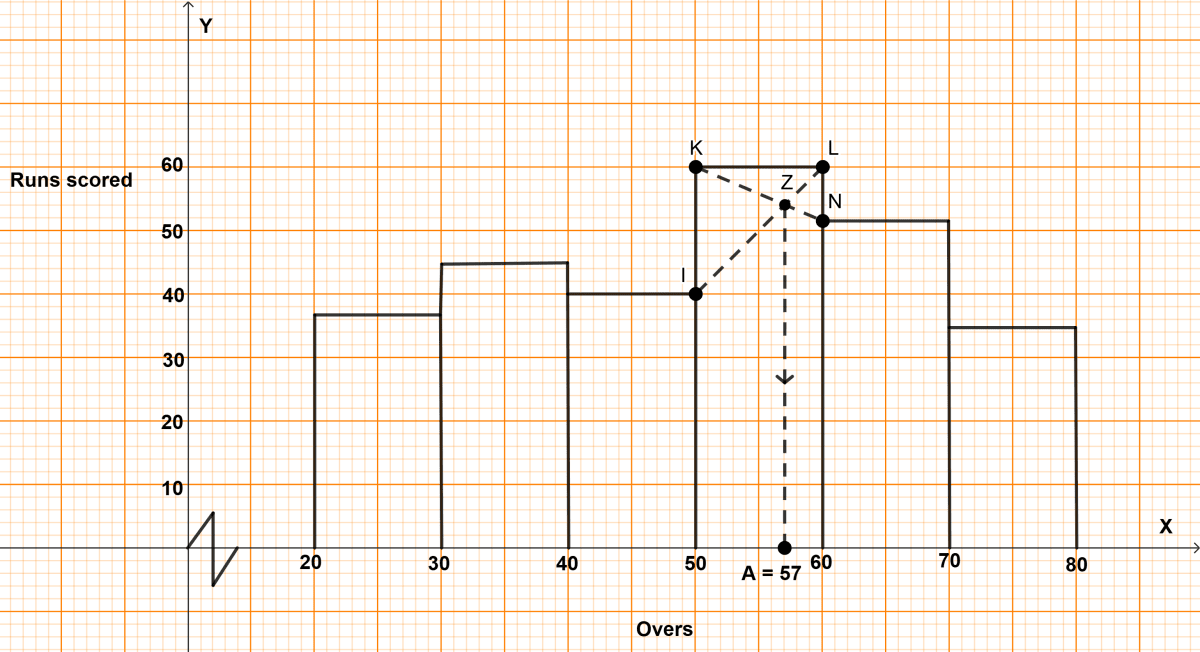
The table given below shows the runs scored by a cricket team during the overs of a match.

OversRuns scored
20-3037
30-4045
40-5040
50-6060
60-7051
70-8035

Use graph sheet for this question. Take 2 cm = 10 overs along one axis and 2 cm = 10 runs along the other axis.

(a) Draw a histogram representing the above distribution.

(b) Estimate the modal runs scored.

Show SolutionHide Solution↓

Steps :

  1. Take 2 cm along x-axis = 10 overs and 1 cm along y-axis = 10 runs.

  2. Since, the scale on x-axis starts at 20, a break (zig-zag curve) is shown near the origin along x-axis to indicate that the graph is drawn to scale beginning at 20 and not at origin itself.

  3. Construct rectangles corresponding to the given data.

  4. In highest rectangle, draw two st. lines KN and LI from corners of the rectangles on either side of the highest rectangle to the opposite corners of the highest rectangle. Let Z be the point of intersection of KN and LI.

  5. Through Z, draw a vertical line to meet the x-axis at A. The abscissa of the point A represents 57.

The table given below shows the runs scored by a cricket team during the overs of a match. ICSE 2025 Maths Solved Question Paper.

Hence, mode = 57.

1Exercise 21.5

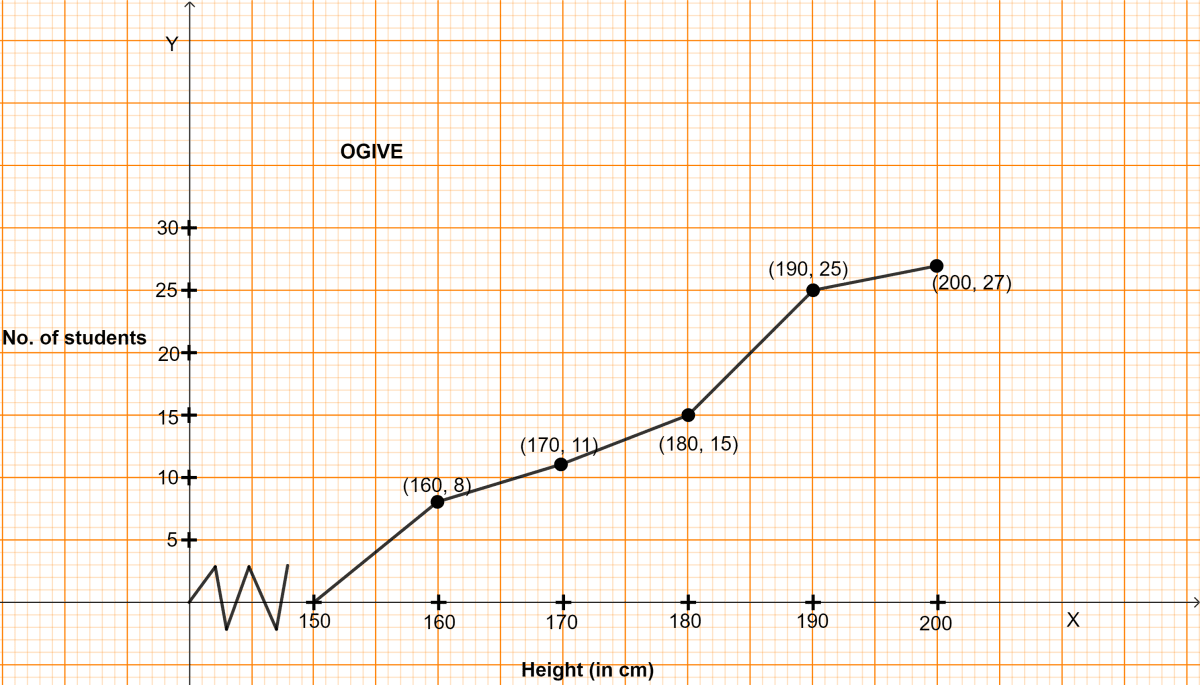
Draw an ogive for the following frequency distribution :

Height (in cm)No. of students
150 - 1608
160 - 1703
170 - 1804
180 - 19010
190 - 2002
Show SolutionHide Solution↓

To draw an ogive :

  1. The cumulative frequency table for the given continuous distribution is :
Height (in cm)No. of studentsCumulative frequency
150 - 16088
160 - 170311
170 - 180415
180 - 1901025
190 - 200227
  1. Since, the scale on x-axis starts at 150, a kink is shown near the origin on x-axis to indicate that the graph is drawn to scale beginning at 150.

  2. Take 2 cm along x-axis = 10 cm (height)

  3. Take 1 cm along y-axis = 5 students

Draw an ogive for the following frequency distribution. Measures of Central Tendency, ML Aggarwal Understanding Mathematics Solutions ICSE Class 10.
  1. Plot the points (160, 8), (170, 11), (180, 15), (190, 25), (200, 27) representing upper class limits and the respective cumulative frequencies.
    Also plot the point representing lower limit of the first class i.e. 150 - 160.

  2. Join these points by a freehand drawing.

The required ogive is shown in figure above.

2Exercise 21.5

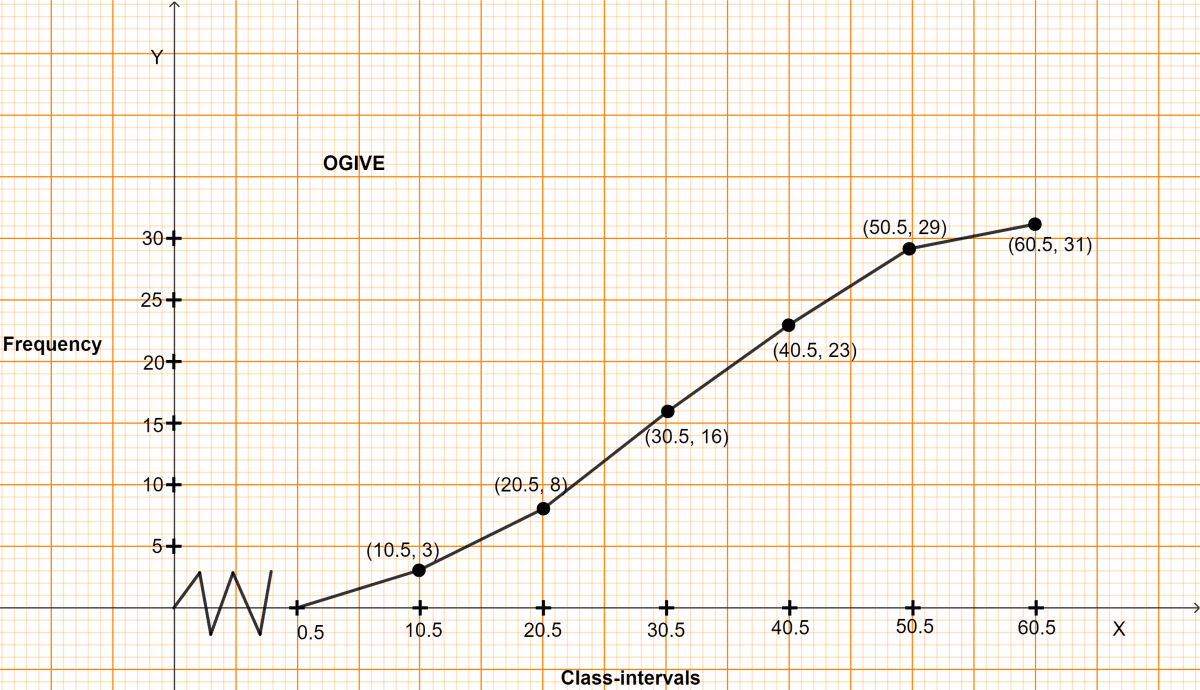
Draw an ogive for the following frequency distribution :

Class-intervalsFrequency
1 - 103
11 - 205
21 - 308
31 - 407
41 - 506
51 - 602
Show SolutionHide Solution↓

To draw an ogive :

  1. The given frequency distribution is discontinuous, to convert it into continuous distribution,
    Adjustment factor = (Lower limit of one class - Upper limit of previous class) / 2
    $= \frac{11 - 10}{2} = \frac{1}{2} = 0.5$

The cumulative frequency table for the given data is :

Classes before adjustmentClasses after adjustmentFrequencyCumulative frequency
1 - 100.5 - 10.533
11 - 2010.5 - 20.558
21 - 3020.5 - 30.5816
31 - 4030.5 - 40.5723
41 - 5040.5 - 50.5629
51 - 6050.5 - 60.5231
  1. Since, the scale on x-axis starts at 0.5, a kink is shown near the origin on x-axis to indicate that the graph is drawn to scale beginning at 0.5

  2. Take 2 cm along x-axis = 10

  3. Take 1 cm along y-axis = 5

Draw an ogive for the following frequency distribution. Measures of Central Tendency, ML Aggarwal Understanding Mathematics Solutions ICSE Class 10.
  1. Plot the points (10.5, 3), (20.5, 8), (30.5, 16), (40.5, 23), (50.5, 29), (60.5, 31) representing upper class limits and the respective cumulative frequencies.

Also plot the point representing lower limit of the first class i.e. 0.5 - 10.5

  1. Join these points by a freehand drawing.

The required ogive is shown in figure above.

3Exercise 21.5

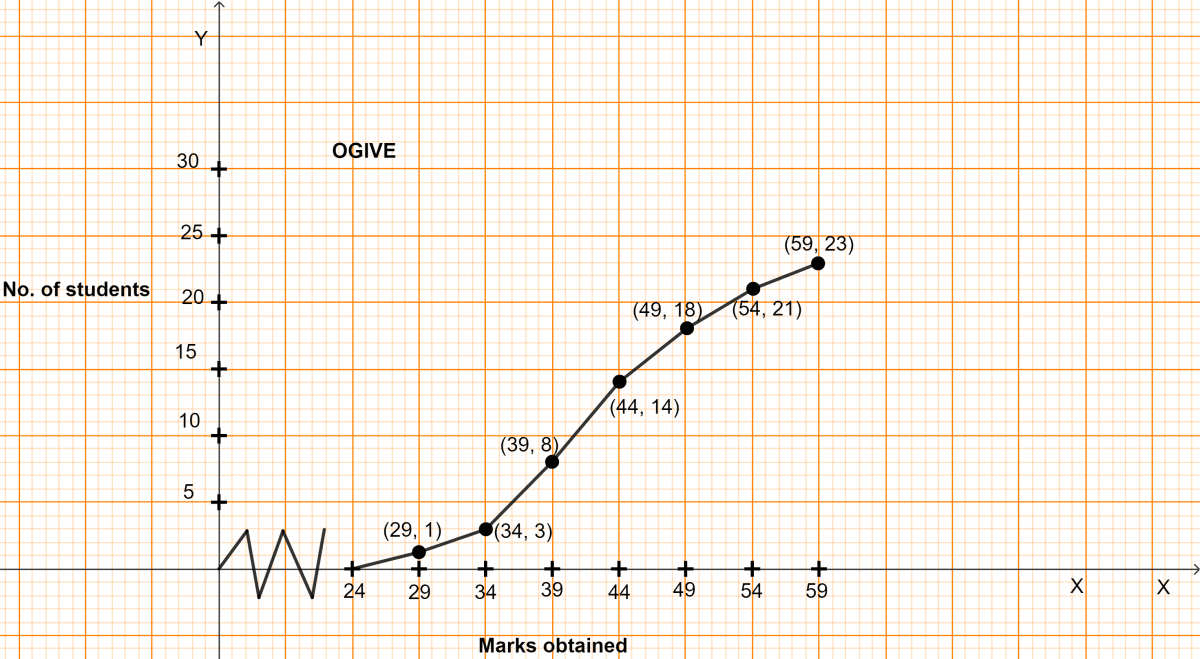
Draw a cumulative frequency curve for the following data :

Marks obtainedNo. of students
24 - 291
29 - 342
34 - 395
39 - 446
44 - 494
49 - 543
54 - 592
Show SolutionHide Solution↓

To draw an ogive :

  1. The cumulative frequency table for the given continuous distribution is :
Marks obtainedNo. of studentsCumulative frequency
24 - 2911
29 - 3423
34 - 3958
39 - 44614
44 - 49418
49 - 54321
54 - 59223
  1. Since, the scale on x-axis starts at 24, a kink is shown near the origin on x-axis to indicate that the graph is drawn to scale beginning at 24.

  2. Take 1 cm along x-axis = 5 marks

  3. Take 1 cm along y-axis = 5 (students)

Draw a cumulative frequency curve for the following data. Measures of Central Tendency, ML Aggarwal Understanding Mathematics Solutions ICSE Class 10.
  1. Plot the points (29, 1), (34, 3), (39, 8), (44, 14), (49, 18), (54, 21) and (59, 23) representing upper class limits and the respective cumulative frequencies.

Also plot the point representing lower limit of the first class i.e. 24 - 29.

  1. Join these points by a freehand drawing.

The required cumulative frequency curve is shown in figure above.

1Exercise 21.6

The weight of 50 workers is given below :

Weight (in kg)No. of workers
50 - 604
60 - 707
70 - 8011
80 - 9014
90 - 1006
100 - 1105
110 - 1203

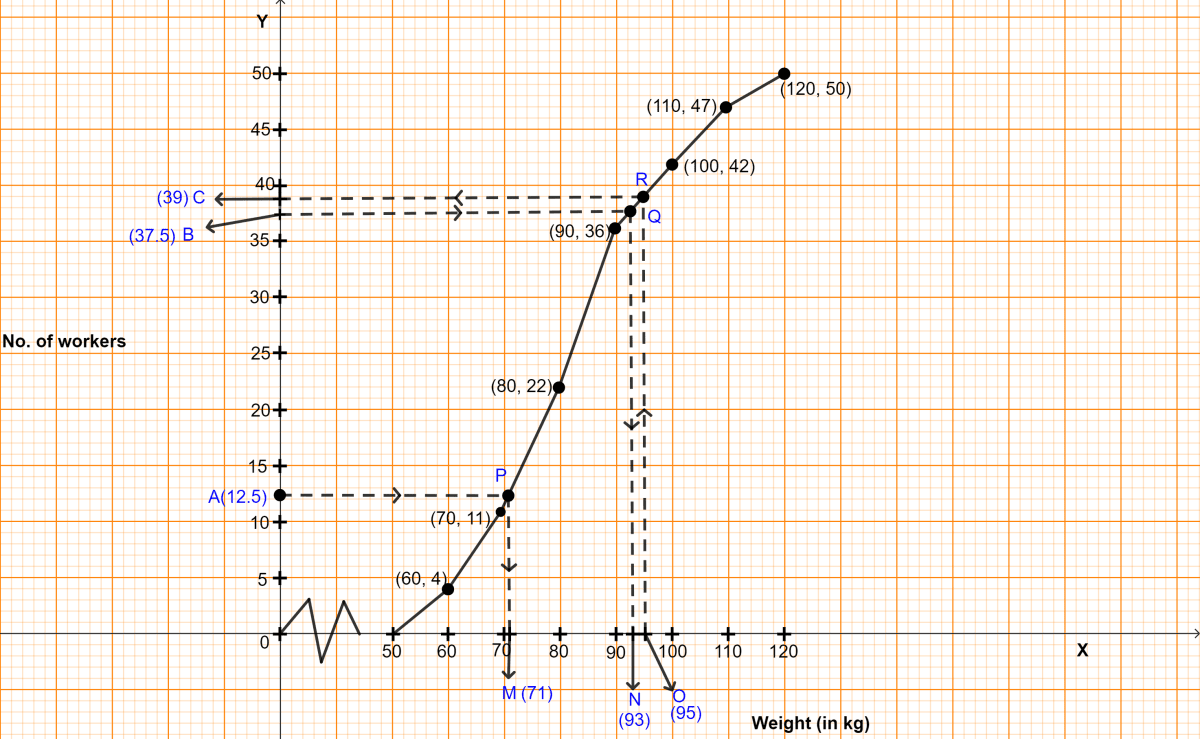
Draw an ogive of the given distribution using a graph sheet. Take 2 cm = 10 kg on one axis and 2 cm = 5 workers along the other axis. Use a graph to estimate the following :

(i) the upper and lower quartiles.

(ii) if weighing 95 kg and above is considered overweight find the number of workers who are overweight.

Show SolutionHide Solution↓
  1. The cumulative frequency table for the given continuous distribution is :
Weight (in kg)No. of workersCumulative frequency
50 - 6044
60 - 70711
70 - 801122
80 - 901436
90 - 100642
100 - 110547
110 - 120350
  1. Take 1 cm along x-axis = 10 kg

  2. Take 1 cm along y-axis = 5 (workers)

  3. Since, scale on x-axis starts at 50, a kink is shown near the origin on x-axis to indicate that the graph is drawn to scale beginning at 50.

  4. Plot the points (60, 4), (70, 11), (80, 22), (90, 36), (100, 42), (110, 47) and (120, 50) representing upper class limits and the respective cumulative frequencies.
    Also plot the point representing lower limit of the first class i.e. 50 - 60.

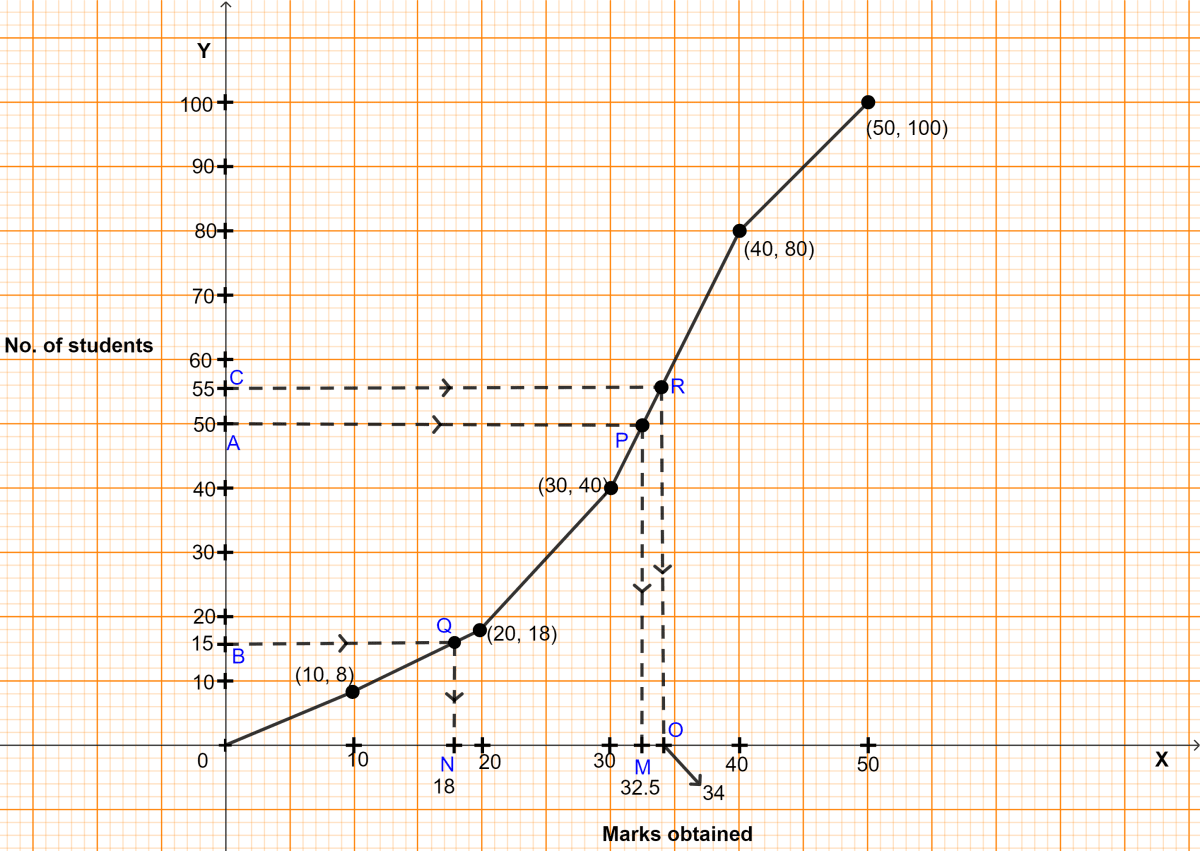
The weight of 50 workers is given below. Draw an ogive of the given distribution using a graph sheet. Take 2 cm = 10 kg on one axis and 2 cm = 5 workers along the other axis. Use a graph to estimate the the upper and lower quartiles, if weighing 95 kg and above is considered overweight find the number of workers who are overweight. Measures of Central Tendency, ML Aggarwal Understanding Mathematics Solutions ICSE Class 10.
  1. Join these points by a freehand drawing.

The required ogive is shown in figure above.

(i) To find lower quartile :

Let A be the point on y-axis representing frequency = $\frac{n}{4} = \frac{50}{4}$ = 12.5

Through A, draw a horizontal line to meet the ogive at P. Through P, draw a vertical line to meet the x-axis at M. The abscissa of the point M represents 71 kg.

To find upper quartile :

Let B be the point on y-axis representing frequency = $\frac{3n}{4} = \frac{150}{4}$ = 37.5

Through B, draw a horizontal line to meet the ogive at Q. Through Q, draw a vertical line to meet the x-axis at N. The abscissa of the point N represents 93 kg.

Hence, lower quartile = 71 kg and upper quartile = 93 kg.

(ii) Let O be the point on x-axis representing 95 kg. Through O draw a vertical line to meet the ogive R. Through R, draw a horizontal line to meet the y-axis at point C. The ordinate of the point C represents 39.

So, the number of people whose weight is less than 95 kg = 39. So, overweight people = 50 - 39 = 11 kg.

Hence, the number of workers who are overweight are 11.

2Exercise 21.6

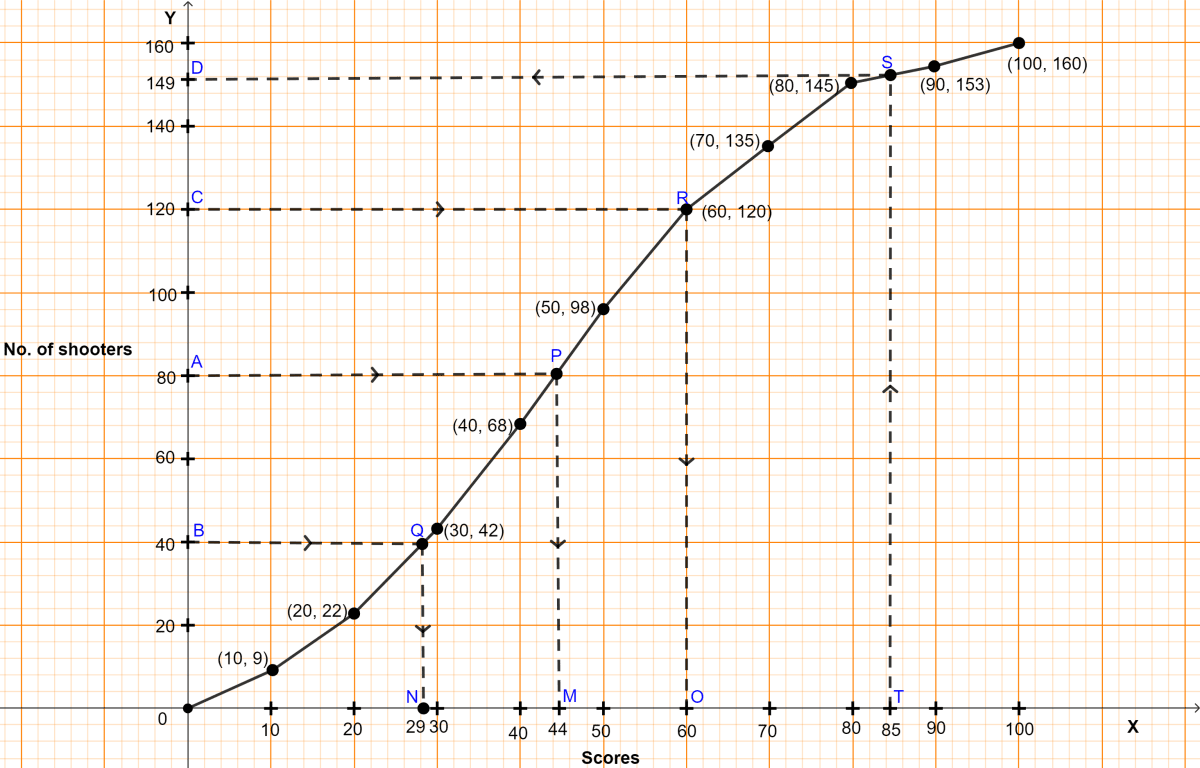
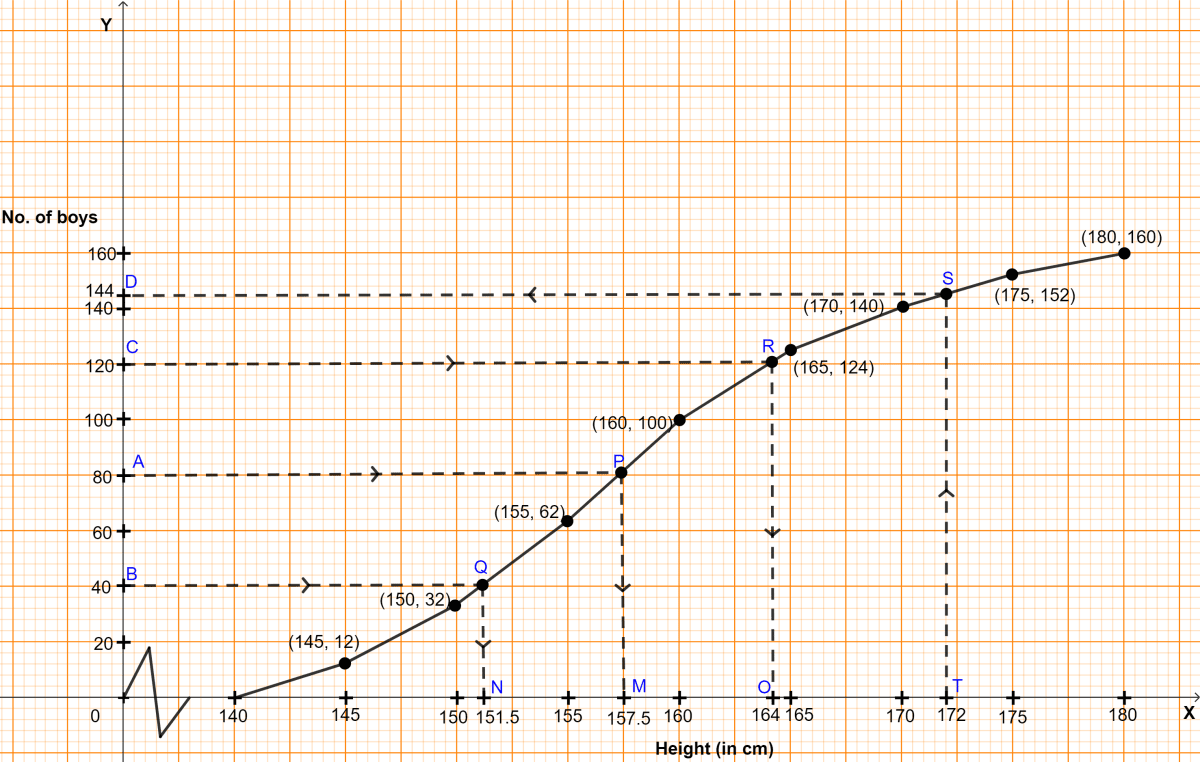
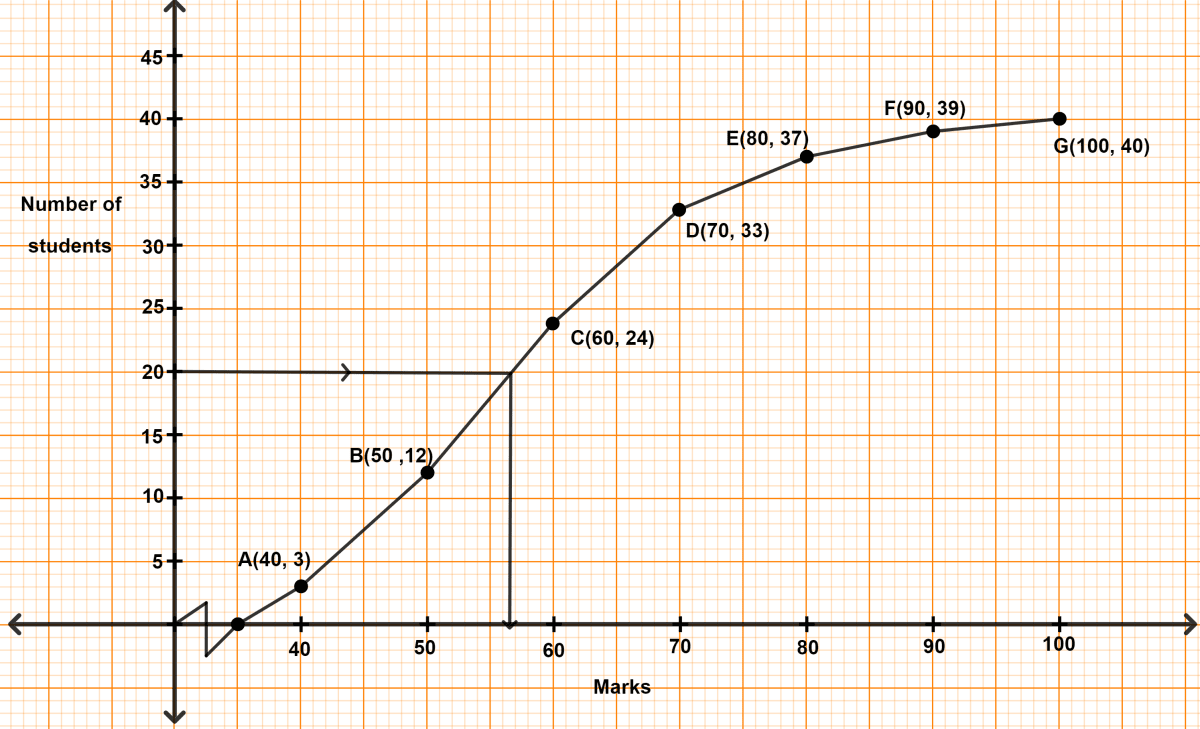
The table shows the distribution of scores obtained by 160 shooters in a shooting competition. Use a graph sheet and draw an ogive for the distribution.

(Take 2 cm = 10 scores on the x-axis and 2 cm = 20 shooters on the y-axis)

ScoresNo. of shooters
0 - 109
10 - 2013
20 - 3020
30 - 4026
40 - 5030
50 - 6022
60 - 7015
70 - 8010
80 - 908
90 - 1007

Use your graph to estimate the following :

(i) The median.

(ii) The inter quartile range.

(iii) The number of shooters who obtained a score of more than 85%.

Show SolutionHide Solution↓
  1. The cumulative frequency table for the given continuous distribution is :
ScoresNo. of shootersCumulative frequency
0 - 1099
10 - 201322
20 - 302042
30 - 402668
40 - 503098
50 - 6022120
60 - 7015135
70 - 8010145
80 - 908153
90 - 1007160
  1. Take 2 cm along x-axis = 10 scores

  2. Take 2 cm along y-axis = 20 (shooters)

  3. Plot the points (10, 9), (20, 22), (30, 42), (40, 68), (50, 98), (60, 120), (70, 135), (80, 145), (90, 153) and (100, 160) representing upper class limits and the respective cumulative frequencies.
    Also plot the point representing lower limit of the first class i.e. 0 - 10.

  4. Join these points by a freehand drawing.

The table shows the distribution of scores obtained by 160 shooters in a shooting competition. Use a graph sheet and draw an ogive for the distribution. Use your graph to estimate the median, the inter quartile range, the number of shooters who obtained a score of more than 85%. Measures of Central Tendency, ML Aggarwal Understanding Mathematics Solutions ICSE Class 10.

The required ogive is shown in figure above.

(i) Here, n (no. of students) = 160.

To find the median :

Let A be the point on y-axis representing frequency = $\frac{n}{2} = \frac{160}{2}$ = 80.

Through A draw a horizontal line to meet the ogive at P. Through P, draw a vertical line to meet the x-axis at M. The abscissa of the point M represents 44.

Hence, the required median score = 44.

(ii) To find lower quartile :

Let B be the point on y-axis representing frequency = $\frac{n}{4} = \frac{160}{4}$ = 40

Through B, draw a horizontal line to meet the ogive at Q. Through Q, draw a vertical line to meet the x-axis at N. The abscissa of the point N represents 29.

To find upper quartile :

Let C be the point on y-axis representing frequency = $\frac{3n}{4} = \frac{480}{4}$ = 120

Through C, draw a horizontal line to meet the ogive at R. Through R, draw a vertical line to meet the x-axis at O. The abscissa of the point O represents 60.

Inter quartile range = Upper quartile - Lower quartile = 60 - 29 = 31.

Hence, the inter quartile range = 31 scores.

(iii) Total marks = 100.

So, more than 85% marks mean more than 85 marks.

Let T be the point on x-axis representing marks = 85.

Through T, draw a vertical line to meet the ogive at S. Through S, draw a horizontal line to meet the y-axis at D. The ordinate of the point D represents 149.

Students who have scored less than 85% = 149.

So, students scoring more than 85% = Total students - Students who have scored less = 160 - 149 = 11.

Hence, there are 11 shooters who obtained a score of more than 85%.

3Exercise 21.6

The daily wages of 80 workers in a project are given below :

Wages (in ₹)No. of workers
400 - 4502
450 - 5006
500 - 55012
550 - 60018
600 - 65024
650 - 70013
700 - 7505

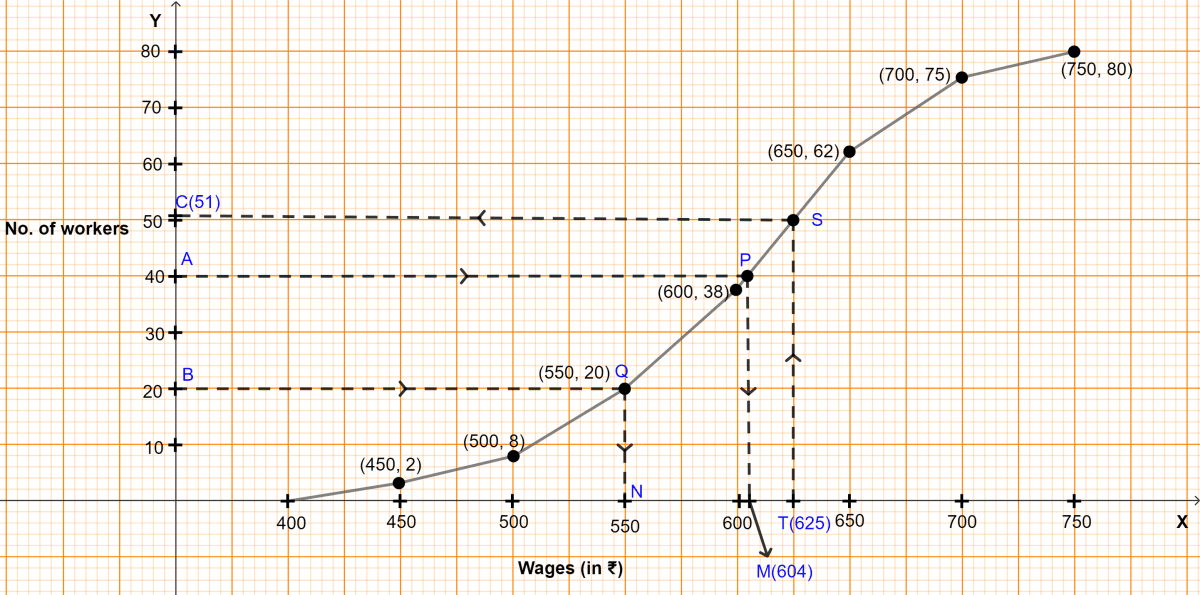
Use a graph paper to draw an ogive for the above distribution. (Use a scale of 2 cm = ₹ 50 on x-axis and 2 cm = 10 workers on y-axis). Use your ogive to estimate :

(i) the median wage of the workers.

(ii) the lower quartile wage of the workers.

(iii) the number of workers who earn more than ₹625 daily.

Show SolutionHide Solution↓
  1. The cumulative frequency table for the given continuous distribution is :
Wages (in ₹)No. of workersCumulative frequency
400 - 45022
450 - 50068
500 - 5501220
550 - 6001838
600 - 6502462
650 - 7001375
700 - 750580
  1. Take 2 cm along x-axis = 50 rupees

  2. Take 1 cm along y-axis = 10 workers

  3. Since, scale on x-axis starts at 400, a kink is shown near the origin on x-axis to indicate that the graph is drawn to scale beginning at 400.

  4. Plot the points (450, 2), (500, 8), (550, 20), (600, 38), (650, 62), (700, 75) and (750, 80) representing upper class limits and the respective cumulative frequencies.
    Also plot the point representing lower limit of the first class i.e. 400 - 450.

  5. Join these points by a freehand drawing.

The daily wages of 80 workers in a project are given below. Use a graph paper to draw an ogive for the above distribution. Use your ogive to estimate the median wage of the workers, the lower quartile wage of the workers, the number of workers who earn more than ₹625 daily. Measures of Central Tendency, ML Aggarwal Understanding Mathematics Solutions ICSE Class 10.

The required ogive is shown in figure above.

(i) Here, n (no. of students) = 80.

To find the median :

Let A be the point on y-axis representing frequency = $\frac{n}{2} = \frac{80}{2}$ = 40.

Through A draw a horizontal line to meet the ogive at P. Through P, draw a vertical line to meet the x-axis at M. The abscissa of the point M represents 604.

Hence, the required median wage = ₹604.

(ii) To find lower quartile :

Let B be the point on y-axis representing frequency = $\frac{n}{4} = \frac{80}{4}$ = 20

Through B, draw a horizontal line to meet the ogive at Q. Through Q, draw a vertical line to meet the x-axis at N. The abscissa of the point N represents 550.

Hence, lower quartile wage = ₹550.

(iii) Let T be the point on x-axis representing wage = ₹625.

Through T, draw a vertical line to meet the ogive at S. Through S, draw a horizontal line to meet the y-axis at C. The ordinate of the point C represents 51.

Workers who earn less than ₹625 = 51.

So, workers earning more than ₹625 = Total workers - workers who earn less than ₹625 = 80 - 51 = 29.

Hence, there are 29 workers earning more than ₹625 daily.

4Exercise 21.6

Marks obtained by 200 students in an examination are given below :

MarksNo. of students
0 - 105
10 - 2011
20 - 3010
30 - 4020
40 - 5028
50 - 6037
60 - 7040
70 - 8029
80 - 9014
90 - 1006

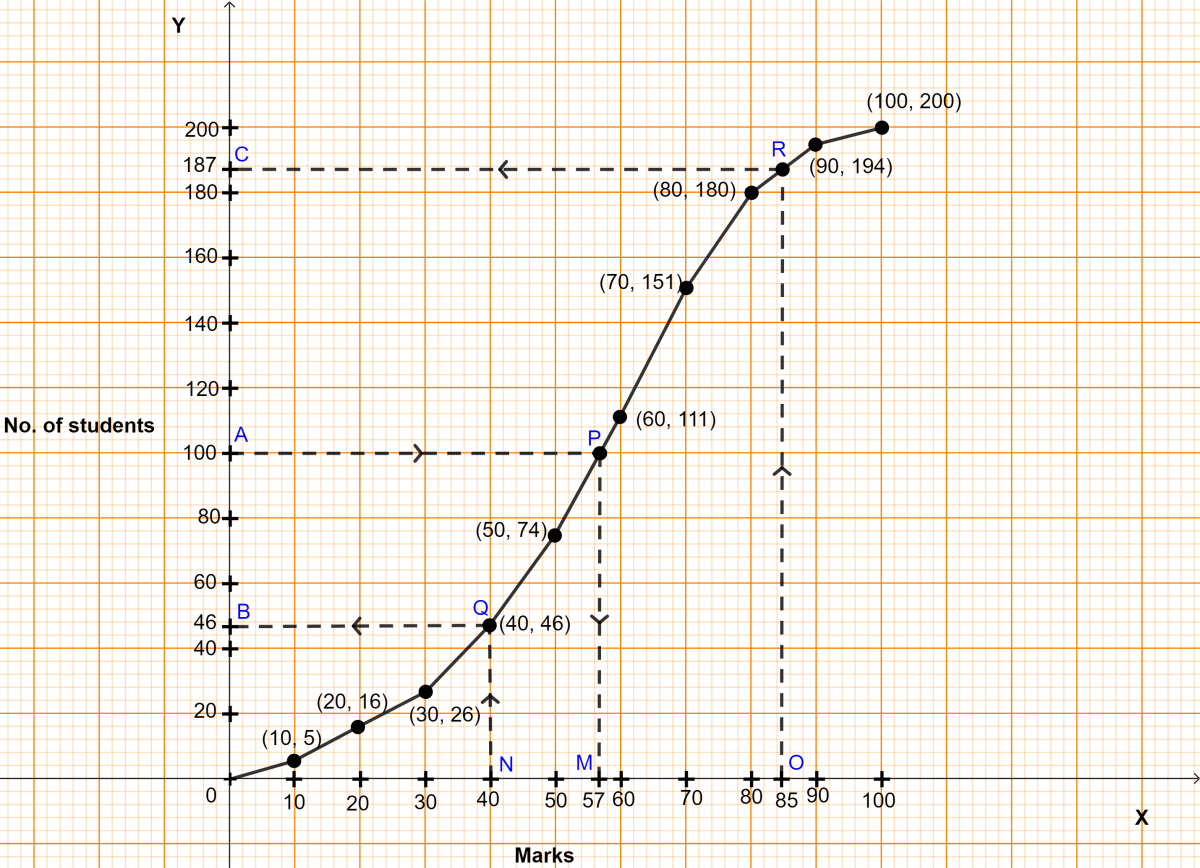
Draw an ogive for the given distribution taking 2 cm = 10 marks on one axis and 2 cm = 20 students on the other axis. Using the graph, determine :

(i) The median marks

(ii) The number of students who failed if minimum marks required to pass is 40.

(iii) If scoring 85 and more marks is considered as grade one, find the number of students who secured grade one in the examination.

Show SolutionHide Solution↓
  1. The cumulative frequency table for the given continuous distribution is :
MarksNo. of studentsCumulative frequency
0 - 1055
10 - 201116
20 - 301026
30 - 402046
40 - 502874
50 - 6037111
60 - 7040151
70 - 8029180
80 - 9014194
90 - 1006200
  1. Take 1 cm along x-axis = 10 scores

  2. Take 1 cm along y-axis = 20 (students)

  3. Plot the points (10, 5), (20, 16), (30, 26), (40, 46), (50, 74), (60, 111), (70, 151), (80, 180), (90, 194) and (100, 200) representing upper class limits and the respective cumulative frequencies.
    Also plot the point representing lower limit of the first class i.e. 0 - 10.

  4. Join these points by a freehand drawing.

Marks obtained by 200 students in an examination are given below. Draw an ogive for the given distribution taking 2 cm = 10 marks on one axis and 2 cm = 20 students on the other axis. Using the graph, determine median marks, the number of students who failed if minimum marks required to pass is 40. If scoring 85 and more marks is considered as grade one, find the number of students who secured grade one in the examination. Measures of Central Tendency, ML Aggarwal Understanding Mathematics Solutions ICSE Class 10.

The required ogive is shown in figure above.

(i) Here, n (no. of students) = 200.

To find the median :

Let A be the point on y-axis representing frequency = $\frac{n}{2} = \frac{200}{2}$ = 100.

Through A draw a horizontal line to meet the ogive at P. Through P, draw a vertical line to meet the x-axis at M. The abscissa of the point M represents 57.

Hence, the required median marks = 57.

(ii) Let N be the point on x-axis representing marks = 40.

Through N, draw a vertical line to meet the ogive at Q. Through Q, draw a horizontal line to meet the y-axis at B. The ordinate of the point B represents 46.

Students who scored less than 40 = 46.

Hence, 46 students failed in the examination.

(iii) Let O be the point on x-axis representing marks = 85.

Through O, draw a vertical line to meet the ogive at R. Through R, draw a horizontal line to meet the y-axis at C. The ordinate of the point C represents 187.

Students who scored less than 85 = 187.

So, students scoring more than 85 = Total students - students scoring less than 85 = 200 - 187 = 13.

Hence, 13 students secured grade one in examination.

5Exercise 21.6

Use graph paper for this question.

A survey regarding height (in cm) of 60 boys belonging to class 10 of a school was conducted. The following data was recorded :

Height (in cm)No. of boys
135 - 1404
140 - 1458
145 - 15020
150 - 15514
155 - 1607
160 - 1656
165 - 1701

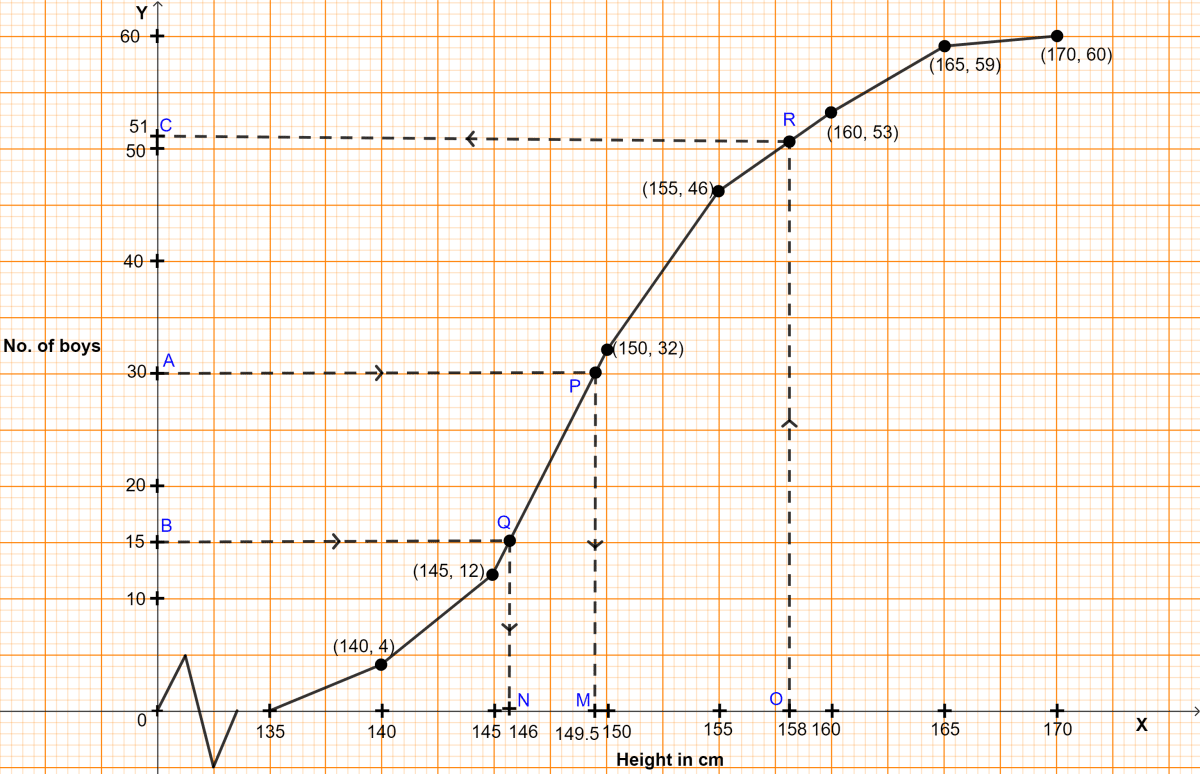
Taking 2 cm = height of 10 cm on one axis and 2 cm = 10 boys along the other axis, draw an ogive of the above distribution. Use the graph to estimate the following :

(i) median

(ii) lower quartile

(iii) if above 158 is considered as the tall boy of the class, find the number of boys in the class who are tall.

Show SolutionHide Solution↓
  1. The cumulative frequency table for the given continuous distribution is :
Height (in cm)No. of boysCumulative frequency
135 - 14044
140 - 145812
145 - 1502032
150 - 1551446
155 - 160753
160 - 165659
165 - 170160
  1. Take 2 cm along x-axis = 5 cm

  2. Take 2 cm along y-axis = 10 (boys)

  3. Since, scale on x-axis starts at 135, a kink is shown near the origin on x-axis to indicate that the graph is drawn to scale beginning at 135.

  4. Plot the points (140, 4), (145, 12), (150, 32), (155, 46), (160, 53), (165, 59) and (170, 60) representing upper class limits and the respective cumulative frequencies.
    Also plot the point representing lower limit of the first class i.e. 135 - 140.

  5. Join these points by a freehand drawing.

A survey regarding height (in cm) of 60 boys belonging to class 10 of a school was conducted. Draw an ogive of the above distribution. Use the graph to estimate the median, lower quartile, if above 158 is considered as the tall boy of the class, find the number of boys in the class who are tall. Measures of Central Tendency, ML Aggarwal Understanding Mathematics Solutions ICSE Class 10.

The required ogive is shown in figure above.

(i) Here, n (no. of students) = 60.

To find the median :

Let A be the point on y-axis representing frequency = $\frac{n}{2} = \frac{60}{2}$ = 30.

Through A draw a horizontal line to meet the ogive at P. Through P, draw a vertical line to meet the x-axis at M. The abscissa of the point M represents 149.5.

Hence, the median height = 149.5 cm.

(ii) To find lower quartile :

Let B be the point on y-axis representing frequency = $\frac{n}{4} = \frac{60}{4}$ = 15.

Through B, draw a horizontal line to meet the ogive at Q. Through Q, draw a vertical line to meet the x-axis at N. The abscissa of the point N represents 146.

Hence, lower quartile = 146 cm.

(iii) Let O be the point on x-axis representing height = 158 cm.

Through O, draw a vertical line to meet the ogive at R. Through R, draw a horizontal line to meet the y-axis at C. The ordinate of the point C represents 51.

No. of boys shorter than 158 cm = 51

So, no. of boys taller than 158 cm = Total boys - boys shorter than 158 cm = 60 - 51 = 9.

Hence, there are 9 tall boys in the class.

6Exercise 21.6

40 students enter for a game of a shot put competition. The distance thrown in metre is recorded below:

Distance in mNumber of students
12 - 133
13 - 149
14 - 1512
15 - 169
16 - 174
17 - 182
18 - 191

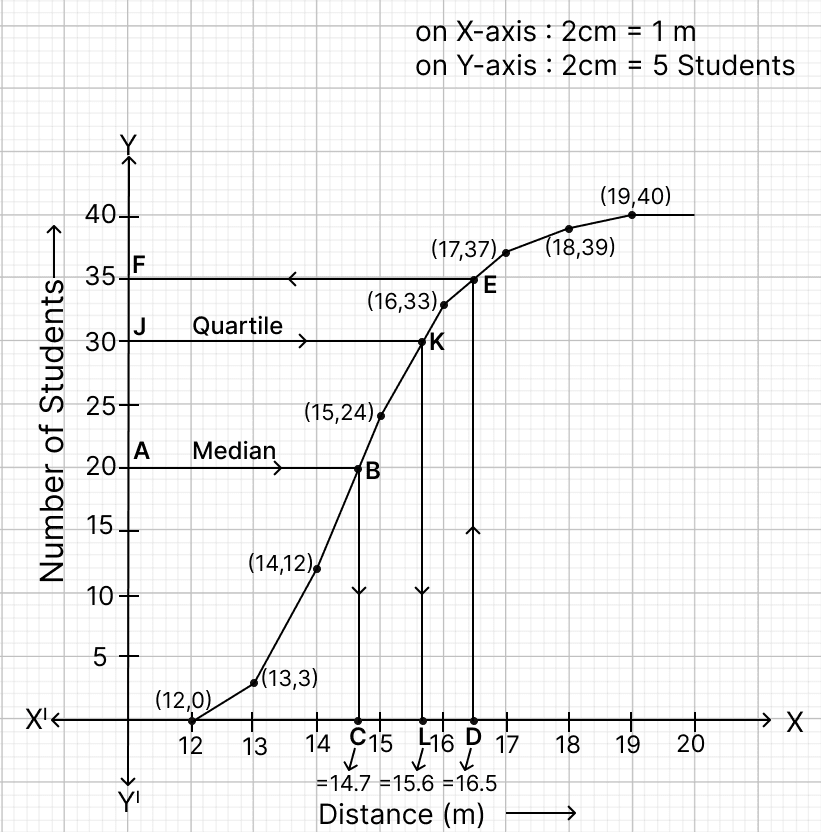
Use a graph paper to draw an ogive for the above distribution.

Uses scale of 2 cm = 1 m on one axis and 2 cm = 5 students on other axis.

Hence, using your graph, find:

(i) the median

(ii) upper quartile

(iii) no. of students who cover a distance which is above $16\frac{1}{2}$ m.

Show SolutionHide Solution↓

Cumulative frequency distribution table :

Distance in mFrequencyCumulative frequency
12 - 1333
13 - 14912
14 - 151224
15 - 16933
16 - 17437
17 - 18239
18 - 19140
40 students enter for a game of a shot put competition. The distance thrown in metre is recorded below: Measures of Central Tendency, ML Aggarwal Understanding Mathematics Solutions ICSE Class 10.

Steps of construction :

  1. Since, the scale on x-axis starts at 12, a break (kink) is shown near the origin on x-axis to indicate that the graph is drawn to scale beginning at 12.

  2. Take 2 cm along x-axis = 1 m.

  3. Take 2 cm along y-axis = 5 students.

  4. Plot the point (12, 0) as ogive starts from x-axis representing lower limit of first class.

  5. Plot the points (13, 3), (14, 12), (15, 24), (16, 33), (17, 37), (18, 39) and (19, 40).

  6. Join the points by a free hand curve.

(i) The total number of students is N = 40. The median position is found at $\frac{N}{2} = \frac{40}{2} = 20$.

Draw a line parallel to x-axis from point A (number of students) = 20, touching the graph at point B. From point B draw a line parallel to y-axis touching x-axis at point C.

From graph, C = 14.7

The median = 14.7 m.

(ii) Here, n = 40, which is even.

By formula,

Upper quartile = $\frac{3n}{4} = \frac{ 3 \times 40}{4} = \frac{120}{4}$ = 30.

Draw a line parallel to x-axis from point J (number of students) = 30, touching the graph at point K. From point K draw a line parallel to y-axis touching x-axis at point L.

From graph, L = 15.6

The upper quartile = 15.6 m

(iii) Draw a line parallel to y-axis from point D (Distance) = $16\frac{1}{2}$ m = 16.5 m, touching the graph at point E. From point E draw a line parallel to x-axis touching y-axis at point F.

From graph, F = 35.

It means that 35 students who cover a distance either less or equal to $16\frac{1}{2}$ m.

Number of student who cover a distance which is above $16\frac{1}{2}$ m = 40 - 35 = 5.

Number of students who cover a distance above $16\frac{1}{2}$ m = 5.

7Exercise 21.6

The marks obtained by 100 students in a Mathematics test are given below :

MarksNo. of students
0 - 103
10 - 207
20 - 3012
30 - 4017
40 - 5023
50 - 6014
60 - 709
70 - 806
80 - 905
90 - 1004

Draw an ogive on a graph sheet and from it determine the :

(i) median

(ii) lower quartile

(iii) number of students who obtained more than 85% marks in the test

(iv) number of students who did not pass in the test if the pass percentage was 35.

Show SolutionHide Solution↓
  1. The cumulative frequency table for the given continuous distribution is :
MarksNo. of studentsCumulative frequency
0 - 1033
10 - 20710
20 - 301222
30 - 401739
40 - 502362
50 - 601476
60 - 70985
70 - 80691
80 - 90596
90 - 1004100
  1. Take 1 cm along x-axis = 10 (marks)

  2. Take 1 cm along y-axis = 10 (students)

  3. Plot the points (10, 3), (20, 10), (30, 22), (40, 39), (50, 62), (60, 76), (70, 85), (80, 91), (90, 96) and (100, 100) representing upper class limits and the respective cumulative frequencies. Also plot the point representing lower limit of the first class i.e. 0 - 10.

  4. Join these points by a freehand drawing.

The marks obtained by 100 students in a Mathematics test are given below. Draw an ogive on a graph sheet and from it determine the median, lower quartile, number of students who obtained more than 85% marks in the test, number of students who did not pass in the test if the pass percentage was 35. Measures of Central Tendency, ML Aggarwal Understanding Mathematics Solutions ICSE Class 10.

The required ogive is shown in figure above.

(i) Here, n (no. of students) = 100.

To find the median :

Let A be the point on y-axis representing frequency = $\frac{n}{2} = \frac{100}{2}$ = 50.

Through A draw a horizontal line to meet the ogive at P. Through P, draw a vertical line to meet the x-axis at M. The abscissa of the point M represents 45

Hence, the median marks = 45.

(ii) To find lower quartile :

Let B be the point on y-axis representing frequency = $\frac{n}{4} = \frac{100}{4}$ = 25.

Through B, draw a horizontal line to meet the ogive at Q. Through Q, draw a vertical line to meet the x-axis at N. The abscissa of the point N represents 32.

Hence, lower quartile = 32.

(iii) Total marks = 100.

85% marks = 85 numbers.

Let O be the point on x-axis representing marks = 85.

Through O draw a vertical line to meet the ogive at R. Through R, draw a horizontal line to meet the y-axis at C. The ordinate of the point C represents 94.

Hence, 94 students score less than 85 so students scoring more than 85 = 100 - 94 = 6.

Hence, 6 students score more than 85% in the test.

(iv) 35% of 100 = 35.

Let T be the point on x-axis representing marks = 35.

Through T, draw a vertical line to meet the ogive at S. Through S, draw a horizontal line to meet the y-axis at D. The ordinate of the point D represents 30.

No. of students who scored less than 35 marks = 30.

Hence, 30 students were failed in the examination.

8Exercise 21.6

The marks obtained by 120 students in a Mathematics test are given below:

MarksNo. of students
0 - 105
10 - 209
20 - 3016
30 - 4022
40 - 5026
50 - 6018
60 - 7011
70 - 806
80 - 904
90 - 1003

Draw an ogive for the given distribution on a graph sheet. Use a suitable scale for ogive to estimate the following :

(i) the median

(ii) the number of students who obtained more than 75% marks in the test.

(iii) the number of students who did not pass in the test if the pass percentage was 40.

Show SolutionHide Solution↓
  1. The cumulative frequency table for the given continuous distribution is :
MarksNo. of studentsCumulative frequency
0 - 1055
10 - 20914
20 - 301630
30 - 402252
40 - 502678
50 - 601896
60 - 7011107
70 - 806113
80 - 904117
90 - 1003120
  1. Take 1 cm along x-axis = 10 marks

  2. Take 1 cm along y-axis = 10 students

  3. Plot the points (10, 5), (20, 14), (30, 30), (40, 52), (50, 78), (60, 96), (70, 107), (80, 113), (90, 117) and (100, 120) representing upper class limits and the respective cumulative frequencies.
    Also plot the point representing lower limit of the first class i.e. 0 - 10.

  4. Join these points by a freehand drawing.

The marks obtained by 120 students in a Mathematics test are given below. Draw an ogive for the given distribution on a graph sheet. Use a suitable scale for ogive to estimate the median, the number of students who obtained more than 75% marks in the test, the number of students who did not pass in the test if the pass percentage was 40. Measures of Central Tendency, ML Aggarwal Understanding Mathematics Solutions ICSE Class 10.

The required ogive is shown in figure above.

(i) Here, n (no. of students) = 120.

To find the median :

Let A be the point on y-axis representing frequency = $\frac{n}{2} = \frac{120}{2}$ = 60.

Through A draw a horizontal line to meet the ogive at P. Through P, draw a vertical line to meet the x-axis at M. The abscissa of the point M represents marks = 43.5

Hence, the median marks = 43.5.

(ii) Total marks = 100.

75% marks = 75 numbers.

Let O be the point on x-axis representing marks = 75.

Through O draw a vertical line to meet the ogive at R. Through R, draw a horizontal line to meet the y-axis at C. The ordinate of the point C represents 110.

Hence, 110 students score less than 75 so students scoring more than 75 = 120 - 110 = 10.

Hence, 10 students score more than 75% in the test.

(iii) 40% of 100 = 40.

Let T be the point on x-axis representing marks = 40.

Through T, draw a vertical line to meet the ogive at S. Through S, draw a horizontal line to meet the y-axis at D. The ordinate of the point D represents 52.

No. of students who scored less than 40 marks = 52.

Hence, 52 students failed in the examination.

9Exercise 21.6

The following distribution represents the height of 160 students of a school.

Height (in cm)No. of students
140 - 14512
145 - 15020
150 - 15530
155 - 16038
160 - 16524
165 - 17016
170 - 17512
175 - 1808

Draw an ogive for the given distribution taking 2 cm = 5 cm of height on one axis and 2 cm = 20 students on the other axis. Using the graph, determine :

(i) The median height.

(ii) The inter quartile range.

(iii) The number of students whose height is above 172 cm.

Show SolutionHide Solution↓
  1. The cumulative frequency table for the given continuous distribution is :
Height (in cm)No. of studentsCumulative frequency
140 - 1451212
145 - 1502032
150 - 1553062
155 - 16038100
160 - 16524124
165 - 17016140
170 - 17512152
175 - 1808160
  1. Take 2 cm along x-axis = 5 cm (height)

  2. Take 1 cm along y-axis = 20 (students)

  3. Since, scale on x-axis starts at 140, a kink is shown near the origin on x-axis to indicate that the graph is drawn to scale beginning at 140.

  4. Plot the points (145, 12), (150, 32), (155, 62), (160, 100), (165, 124), (170, 140), (175, 152) and (180, 160) representing upper class limits and the respective cumulative frequencies. Also plot the point representing lower limit of the first class i.e. 140 - 145.

  5. Join these points by a freehand drawing.

The following distribution represents the height of 160 students of a school. Draw an ogive for the given distribution taking 2 cm = 5 cm of height on one axis and 2 cm = 20 students on the other axis. Using the graph, determine median height, inter quartile range, number of students whose height is above 172 cm. Measures of Central Tendency, ML Aggarwal Understanding Mathematics Solutions ICSE Class 10.

The required ogive is shown in figure above.

(i) Here, n (no. of students) = 160.

To find the median :

Let A be the point on y-axis representing frequency = $\frac{n}{2} = \frac{160}{2}$ = 80.

Through A draw a horizontal line to meet the ogive at P. Through P, draw a vertical line to meet the x-axis at M. The abscissa of the point M represents height = 157.5 cm.

Hence, the median height = 157.5 cm.

(ii) To find lower quartile :

Let B be the point on y-axis representing frequency = $\frac{n}{4} = \frac{160}{4}$ = 40

Through B, draw a horizontal line to meet the ogive at Q. Through Q, draw a vertical line to meet the x-axis at N. The abscissa of the point N represents 151.5.

To find upper quartile :

Let C be the point on y-axis representing frequency = $\frac{3n}{4} = \frac{480}{4}$ = 120

Through C, draw a horizontal line to meet the ogive at R. Through R, draw a vertical line to meet the x-axis at O. The abscissa of the point O represents 164.

Inter quartile range = Upper quartile - Lower quartile = 164 - 151.5 = 12.5.

Hence, the inter quartile range = 12.5 cm.

(iii) Let T be the point on x-axis representing height = 172 cm.

Through T, draw a vertical line to meet the ogive at S. Through S, draw a horizontal line to meet the y-axis at D. The ordinate of the point D represents 144.

No. of students shorter than 172 cm = 144.

So, no. of students taller than 172 cm = Total students - No. of students shorter than 172 cm = 160 - 144 = 16.

Hence, there are 16 students taller than 172 cm.

10Exercise 21.6

Study the graph and answer each of the following :

(a) Name the curve plotted

(b) Total number of students

(c) The median marks

(d) Number of students scoring between 50 and 80 marks.

Study the graph and answer each of the following : ICSE 2024 Maths Specimen Solved Question Paper.
Show SolutionHide Solution↓

(a) From graph,

The curve plotted is a cumulative frequency curve (ogive).

(b) From graph,

The total number of students = 40.

(c) From graph,

The median marks = 56.

(d) From graph,

No of students scoring below 80 = 37

No of students scoring below 50 = 12

∴ No. of students scoring between 50 and 80 = 37 - 12 = 25.

Hence, the no. of students scoring between 50 and 80 = 25.

11 Mark · Multiple Choice Questions

If the classes of a frequency distribution are 1 - 10, 11 - 20, 21 - 30, ...., 51 - 60, then the size of each class is

Show SolutionHide Solution↓

On converting the class from discontinuous intervals into continuous intervals.

Adjustment factor = (Lower limt of one class - Upper limit of previous class) / 2

$$\begin{aligned}= \frac{11 - 10}{2} \\[1em] = \frac{1}{2} \\[1em] = 0.5\end{aligned}$$

Classes before adjustmentClasses after adjustment
1 - 100.5 - 10.5
11 - 2010.5 - 20.5
21 - 3020.5 - 30.5
31 - 4030.5 - 40.5
41 - 5040.5 - 50.5
51 - 6050.5 - 60.5

Class interval = 10.5 - 0.5 = 10.

Hence, Option 2 is the correct option.

21 Mark · Multiple Choice Questions

If the classes of a frequency distribution are 1 - 10, 11 - 20, 21 - 30, ....., 61 - 70, then the upper limit of the class 11 - 20 is

Show SolutionHide Solution↓

On converting the class from discontinuous intervals into continuous intervals.

Adjustment factor = (Lower limt of one class - Upper limit of previous class) / 2

$$\begin{aligned}= \frac{11 - 10}{2} \\[1em] = \frac{1}{2} \\[1em] = 0.5\end{aligned}$$

Classes before adjustmentClasses after adjustment
1 - 100.5 - 10.5
11 - 2010.5 - 20.5
21 - 3020.5 - 30.5
31 - 4030.5 - 40.5
41 - 5040.5 - 50.5
51 - 6050.5 - 60.5
61 - 7060.5 - 70.5

From table, the upper limit of the class 11 - 20 is 20.5

Hence, Option 4 is the correct option.

31 Mark · Multiple Choice Questions

In a grouped frequency distribution, the mid-values of the classes are used to measure which of the following central tendency?

Show SolutionHide Solution↓

In a grouped frequency distribution, the mid-values of the classes are used to measure mean.

Hence, Option 3 is the correct option.

41 Mark · Multiple Choice Questions

In the formula : x̄ = a + $\frac{Σ f_id_i}{Σ f_i}$ for finding the mean of the grouped data, di's are deviations from a (assumed mean) of

Show SolutionHide Solution↓

In the formula : x̄ = a + $\frac{Σ f_id_i}{Σ f_i}$ for finding the mean of the grouped data, di's are deviations from a (assumed mean) of mid-points of the classes.

Hence, Option 3 is the correct option.

51 Mark · Multiple Choice Questions

Construction of a cumulative frequency distribution table is useful in determining the

Show SolutionHide Solution↓

Cumulative frequency distribution table is useful in determining the median.

Hence, Option 2 is the correct option.

61 Mark · Multiple Choice Questions

The median class for the given distribution is:

Class IntervalFrequency
0 - 102
10 - 204
20 - 303
30 - 405
Show SolutionHide Solution↓

The given class intervals are already in ascending order. We construct the cumulative frequency table as under :

Class IntervalFrequencyCumulative frequency
0 - 1022
10 - 2046
20 - 3039
30 - 40514

Here, Cumulative frequency = 14, which is even.

By formula,

$$\begin{aligned}\text{Median }= \frac{\frac{n}{2}\text{th observation} + \Big(\frac{n}{2} + 1\Big)\text{th observation}}{2}\\[1em] = \frac{\frac{14}{2}\text{th observation} + \Big(\frac{14}{2} + 1\Big)\text{th observation}}{2}\\[1em] = \frac{7\text{th observation} + (7 + 1)\text{th observation}}{2}\\[1em] = \frac{7\text{th observation} + 8\text{th observation}}{2}\\[1em]\end{aligned}$$

All observations from 7th to 8th are equal, each lies in the interval 20 - 30.

So, median class = 20 - 30

Hence, option 3 is the correct option.

71 Mark · Multiple Choice Questions

Consider the following frequency distribution :

ClassFrequency
0 - 513
6 - 1110
12 - 1715
18 - 238
24 - 2911

The upper limit of the median class is

Show SolutionHide Solution↓

Converting the discontinuous interval into continuous interval.

Adjustment factor = (Lower limt of one class - Upper limit of previous class) / 2

$$\begin{aligned}= \frac{11 - 10}{2} \\[1em] = \frac{1}{2} \\[1em] = 0.5\end{aligned}$$

We construct the cumulative frequency distribution table as under :

Classes before adjustmentClasses after adjustmentFrequencyCumulative frequency
0 - 50 - 5.51313
6 - 115.5 - 11.51023
12 - 1711.5 - 17.51538
18 - 2317.5 - 23.5846
24 - 2923.5 - 29.51157

Here n (total no. of observations) = 57.

As n is odd,

$$\begin{aligned}\therefore \text{Median } = \frac{n + 1}{2} \text{th observation} \\[1em] = \frac{57 + 1}{2} \\[1em] = \frac{58}{2} \\[1em] = 29 \text{th observation}\end{aligned}$$

As observation from 24th to 38th lies in the class 11.5 - 17.5

∴ Median class = 11.5 - 17.5, with upper limit = 17.5

Hence, Option 2 is the correct option.

81 Mark · Multiple Choice Questions

For the following distribution :

ClassFrequency
0 - 510
5 - 1015
10 - 1512
15 - 2020
20 - 259

The sum of lower limits of the median class and modal class is

Show SolutionHide Solution↓

We construct the cumulative frequency distribution table as under :

ClassFrequencyCumulative frequency
0 - 51010
5 - 101525
10 - 151237
15 - 202057
20 - 25966

Here n (total no. of observations) = 66.

As n is even,

∴ Median = ($\frac{n}{2}$th observation + ($\frac{n}{2} + 1$)th observation) / 2

$$\begin{aligned}= \frac{\frac{66}{2} + \Big(\frac{66}{2} + 1\Big)}{2} \\[1em] = \frac{33\text{th observation} + 34\text{th observation}}{2}\end{aligned}$$

As observation from 26th to 37th lie in the class 10 - 15,

∴ Median class = 10 - 15.

Since the class 15 - 20 has highest frequency i.e. 20.

∴ Modal class = 15 - 20.

Sum of lower limit of median and modal class = 10 + 15 = 25.

Hence, Option 2 is the correct option.

91 Mark · Multiple Choice Questions

The modal class of a given distribution always corresponds to the:

Show SolutionHide Solution↓

The "modal class" refers to the interval in a frequency distribution that has the highest number of observations, meaning it's the class with the most occurrences.

Hence, option 1 is the correct option.

101 Mark · Multiple Choice Questions

An ogive curve is used to determine

Show SolutionHide Solution↓

An ogive curve is used to determine median.

Hence, Option 4 is the correct option.

111 Mark · Multiple Choice Questions

The median of the following observations arranged in ascending order is 64. Find the value of x :

27, 31, 46, 52, x, x + 4, 71, 79, 85, 90

Show SolutionHide Solution↓

No. of observations = 10, which is even.

Median = $\frac{n}{2}\text{th term} = \frac{10}{2}$ = 5th term.

Given,

Median = 64

∴ x + 4 = 64

⇒ x = 64 - 4 = 60.

Hence, Option 1 is the correct option.

1Assertion-Reason Type Questions

Assertion (A): Mean of the prime numbers lying between 5 and 20 is 13.4

Reason (R): Mean = $\frac{\text{sum of all observations}}{\text{number of observations}}$

Show SolutionHide Solution↓

The prime numbers between 5 and 20 are: 7, 11, 13, 17, 19 .

There are 5 such primes.

By formula,

Mean = $\frac{\text{sum of all observations}}{\text{number of observations}}$

∴ Reason (R) is true.

Mean = $\frac{7 + 11 + 13 + 17 + 19}{5} = \frac{67}{5}$ = 13.4

∴ Assertion (A) is true.

∴ Both Assertion (A) and Reason (R) are correct, and Reason (R) is the correct reason for Assertion (A).

Hence, option 3 is the correct option.

2Assertion-Reason Type Questions

Assertion (A): A survey was conducted by a group of students as a part of their environment awareness program, in which they collected the following data regarding the number of plants in 10 houses in a locality:

Number of plantsNumber of houses
2 - 42
4 - 63
6 - 81
8 - 103
10 - 121

The mean of the data is 6.9

Reason (R): If the observation x1, x2, x3,........., xk has frequencies f1, f2, f3, ........, fk, then mean = $\frac{f_1x_1 + f_2x_2 + f_3x_3 + ........ + f_kx_k}{f_1 + f_2 + f_3 + ........ + f_k}$

Show SolutionHide Solution↓
Number of plantsClass mark(xi)Number of houses(fi)fi.xi
2 - 4326
4 - 65315
6 - 8717
8 - 109327
10 - 1211111
TotalΣfi = 10Σfixi = 66

Mean = $\frac{∑f_ix_i}{∑f_i} = \frac{f_1x_1 + f_2x_2 + f_3x_3 + ........ + f_kx_k}{f_1 + f_2 + f_3 + ........ + f_k}$

∴ Reason (R) is true.

Mean = $\frac{66}{10}$​ = 6.6

∴ Assertion (A) is false.

∴ Assertion (A) is false, but Reason (R) is true.

Hence, option 2 is the correct option.

3Assertion-Reason Type Questions

Assertion (A): The number of goals scored by a football team in a series of matches are 3, 1, 0, 7, 5, 3, 3, 4, 1, 2, 0, 2

The median of the data is 2.5.

Reason (R): Median of an ungrouped data is the variate which has maximum frequency.

Show SolutionHide Solution↓

Given goals: 3, 1, 0, 7, 5, 3, 3, 4, 1, 2, 0, 2

Arrange the data in ascending order: 0, 0, 1, 1, 2, 2, 3, 3, 3, 4, 5, 7

There are 12 values (even).

By formula,

$$\begin{aligned}\text{Median }= \frac{\frac{n}{2}\text{th observation} + \Big(\frac{n}{2} + 1\Big)\text{th observation}}{2}\\[1em] = \frac{\frac{12}{2}\text{th observation} + \Big(\frac{12}{2} + 1\Big)\text{th observation}}{2}\\[1em] = \frac{6\text{th observation} + (6 + 1)\text{th observation}}{2}\\[1em] = \frac{6\text{th observation} + 7\text{th observation}}{2}\\[1em] = \frac{(2 + 3)}{2} = \frac{5}{2} \\[1em] = 2.5.\end{aligned}$$

∴ Assertion (A) is true.

The median is a measure of central tendency that splits your ordered data into two equal parts—half the observations lie below it, and half lie above it.

∴ Reason (R) is false.

∴ Assertion (A) is true, but Reason (R) is false.

Hence, option 1 is the correct option.

4Assertion-Reason Type Questions

For the given 25 variables : x1, x2, x3,........., x25.

Assertion (A): To find median of the given data, the variate need to be arranged in ascending or descending order.

Reason (R): The median is the central most term of the arranged data.

Show SolutionHide Solution↓

For the given 25 variables : x1, x2, x3,........., x25.

To compute the median, you must first arrange the data in either ascending or descending order. Only with ordered data, the middle value can be identified.

∴ Assertion (A) is true.

The median is a measure of central tendency that splits your ordered data into two equal parts—half the observations lie below it, and half lie above it.

Thus, the median is the central most term of the arranged data.

∴ Reason (R) is true.

∴ Both Assertion (A) and Reason (R) are correct, and Reason (R) is the correct reason for Assertion (A).

Hence, option 3 is the correct option.

1Chapter Test

The mean of 20 numbers is 18. If 3 is added to each of the first ten numbers, find the mean of new set of 20 numbers.

Show SolutionHide Solution↓

Mean = $\frac{\text{Sum of observations}}{\text{No. of observations}}$

∴ Sum of observations = Mean × No. of observations
⇒ Sum of observations = 18 × 20 = 360.

Since 3 is added to first ten numbers then total sum increases by 10 × 3 = 30.

New sum = 360 + 30 = 390.

Mean = $\frac{\text{Sum of observations}}{\text{No. of observations}} = \frac{390}{20}$ = 19.5

Hence, the mean of new set of 20 numbers is 19.5

2Chapter Test

The average height of 30 students is 150 cm. It was detected later that one value of 165 cm was wrongly copied as 135 cm for the computation of mean. Find the correct mean.

Show SolutionHide Solution↓

Mean = $\frac{\text{Sum of observations}}{\text{No. of observations}}$

∴ Sum of observations = Mean × No. of observations
⇒ Sum of observations = 150 × 30 = 4500.

Since, one value of 165 cm was wrongly copied as 135 cm,

∴ Correct sum of observations = 4500 - 135 + 165 = 4530.

Correct mean = $\frac{\text{Sum of observations}}{\text{No. of observations}} = \frac{4530}{30}$ = 151.

Hence, the correct mean is 151 cm.

3Chapter Test

There are 50 students in a class of which 40 are boys and the rest girls. The average weight of the students in the class is 44 kg and the average weight of the girls is 40 kg. Find the average weight of boys.

Show SolutionHide Solution↓

No. of girls = Total - No. of boys = 50 - 40 = 10.

Average weight of class = $\frac{\text{Total weight}}{\text{No. of students}}$

∴ Total weight = Average weight × No. of students
⇒ Total weight = 44 × 50 = 2200

Average weight of girls = $\frac{\text{Weight of girls}}{\text{No. of girls}}$

∴ Weight of girls = Average weight of girls × No. of girls
⇒ Weight of girls = 40 × 10 = 400.

Total weight of boys = Total weight - Weight of girls = 2200 - 400 = 1800.

Average weight of boys = $\frac{\text{Weight of boys}}{\text{No. of boys}} = \frac{1800}{40}$ = 45.

Hence, the average weight of boys is 45 kg.

4Chapter Test

The heights of 50 children were measured (correct to the nearest cm) giving the following results :

Height (in cm)No. of children
651
664
675
687
6911
7010
716
724
732

Calculate the mean height for this distribution correct to one place of decimal.

Show SolutionHide Solution↓

We construct the table as under :

Height (xi)No. of children (fi)fixi
65165
664264
675335
687476
6911759
7010700
716426
724288
732146
Total503459

Mean = $\frac{Σf_ix_i}{Σf_i} = \frac{3459}{50}$ = 69.2 cm.

Hence, mean height = 69.2 cm.

5Chapter Test

Find the value of p, if the mean of the following distribution is 18.

Variate (x)Frequency (f)
138
152
173
194
20 + p5p
236
Show SolutionHide Solution↓

We construct the table as under :

Variate (x)Frequency (f)fx
138104
15230
17351
19476
20 + p5p5p2 + 100p
236138
Total5p + 235p2 + 100p + 399

$$\begin{aligned}\text{Mean} = \frac{Σfx}{Σf} \\[1em] \therefore 18 = \frac{5p^2 + 100p + 399}{5p + 23} \\[1em] \Rightarrow 90p + 414= 5p^2 + 100p + 399 \\[1em] \Rightarrow 5p^2 + 100p - 90p + 399 - 414 = 0 \\[1em] \Rightarrow 5p^2 + 10p - 15 = 0 \\[1em] \Rightarrow 5p^2 + 15p - 5p - 15 = 0 \\[1em] \Rightarrow 5p(p + 3) - 5(p + 3) = 0 \\[1em] \Rightarrow (5p - 5)(p + 3) = 0 \\[1em]\end{aligned}$$

⇒ 5p - 5 = 0 or p + 3 = 0
⇒ 5p = 5 or p = -3
⇒ p = 1 or p = -3.

Since, frequency cannot be negative so p = 1.

Hence, the value of p = 1.

6Chapter Test

Find the mean age in years from the frequency distribution given below :

Age in yearsNo. of persons
25 - 294
30 - 3414
35 - 3922
40 - 4416
45 - 496
50 - 545
55 - 593
Show SolutionHide Solution↓

The above data is discontinuous converting in continuous data we get,

Adjustment factor = (Lower limt of one class - Upper limit of previous class) / 2

$$\begin{aligned}= \frac{30 - 29}{2} \\[1em] = \frac{1}{2} \\[1em] = 0.5\end{aligned}$$

Classes before adjustmentClasses after adjustmentClass mark (ui)No. of persons (fi)fiui
25 - 2924.5 - 29.5274108
30 - 3429.5 - 34.53214448
35 - 3934.5 - 39.53722814
40 - 4439.5 - 44.54216672
45 - 4944.5 - 49.5476282
50 - 5449.5 - 54.5525260
55 - 5954.5 - 59.5573171
Total702755

Mean = $\frac{Σf_iu_i}{Σf_i} = \frac{2755}{70}$ = 39.36 years

Hence, the mean age = 39.36 years.

7Chapter Test

The mean of the following frequency distribution is 62.8. Find the value of p :

ClassesFrequency
0 - 205
20 - 408
40 - 60p
60 - 8012
80 - 1007
100 - 1208
Show SolutionHide Solution↓

We construct the following table :

ClassesClass mark (ui)Frequency (fi)fiui
0 - 2010550
20 - 40308240
40 - 6050p50p
60 - 807012840
80 - 100907630
100 - 1201108880
Total40 + p2640 + 50p

$$\begin{aligned}\text{Mean} = \frac{Σf_iu_i}{Σf_i} \\[1em] \Rightarrow 62.8 = \frac{2640 + 50p}{40 + p} \\[1em] \Rightarrow 62.8(40 + p) = 2640 + 50p \\[1em] \Rightarrow 2512 + 62.8p = 2640 + 50p \\[1em] \Rightarrow 62.8p - 50p = 2640 - 2512 \\[1em] \Rightarrow 12.8p = 128 \\[1em] \Rightarrow p = 10.\end{aligned}$$

Hence, the value of p = 10.

8Chapter Test

The daily expenditure on milk and vegetables of 100 families are given below. Calculate f1 and f2, if the mean daily expenditure is ₹188.

Expenditure (in ₹)No. of families
140 - 1605
160 - 18025
180 - 200f1
200 - 220f2
220 - 2405
Show SolutionHide Solution↓

We construct the table as under :

Expenditure (in ₹)Class mark (ui)No. of families (fi)fiui
140 - 1601505750
160 - 180170254250
180 - 200190f1190f1
200 - 220210f2210f2
220 - 24023051150
Total35 + f1 + f26150 + 190f1 + 210f2

As there are 100 families,

∴ 35 + f1 + f2 = 100
⇒ f1 + f2 = 100 - 35 = 65
⇒ f1 = 65 - f2      ......(i)

$$\begin{aligned}\text{Mean} = \frac{Σf_iu_i}{Σf_i} \\[1em] \Rightarrow 188 = \frac{6150 + 190f_1 + 210f_2}{35 + f_1 + f_2} \\[1em] \Rightarrow 188(35 + f_1 + f_2) = 6150 + 190f_1 + 210f_2 \\[1em] \Rightarrow 188(35 + 65 - f_2 + f_2) = 6150 + 190(65 - f_2) + 210f_2 \text{ .......(Using (i))} \\[1em] \Rightarrow 188(100) = 6150 + 12350 - 190f_2 + 210f_2 \\[1em] \Rightarrow 18800 = 18500 + 20f_2 \\[1em] \Rightarrow 18800 - 18500 = 20f_2 \\[1em] \Rightarrow 20f_2 = 300 \\[1em] \Rightarrow f_2 = 15.\end{aligned}$$

Using (i),

⇒ f1 = 65 - f2 = 65 - 15 = 50.

Hence, f1 = 50 and f2 = 15.

9Chapter Test

The median of the following numbers, arranged in ascending order, is 25. Find x :

11, 13, 15, 19, x + 2, x + 4, 30, 35, 39, 46.

Show SolutionHide Solution↓

Here, n (no. of observations) = 10, which is even.

$$\begin{aligned}\therefore \text{Median} = \frac{\frac{n}{2} \text{th observation} + \big(\frac{n}{2} + 1\big)\text{ th observation}}{2} \\[1em] = \frac{\frac{10}{2} \text{th observation} + \big(\frac{10}{2} + 1\big)\text{ th observation}}{2} \\[1em] = \frac{\text{ 5th observation + 6th observation}}{2} \\[1em] = \frac{x + 2 + x + 4}{2} \\[1em] = \frac{2x + 6}{2} \\[1em] = x + 3.\end{aligned}$$

Given, median = 25.

∴ x + 3 = 25
⇒ x = 22.

Hence, the value of x = 22.

10Chapter Test

If the median of 5, 9, 11, 3, 4, x, 8 is 6, find the value of x.

Show SolutionHide Solution↓

Arranging the numbers in ascending order we get,

3, 4, 5, x, 8, 9, 11.

Here n (no. of observations) = 7

$$\begin{aligned}\therefore \text{Median} = \frac{n + 1}{2} \text{th observation} \\[1em] = \frac{7 + 1}{2} \\[1em] = \frac{8}{2} \\[1em] = 4 \text{th observation}.\end{aligned}$$

Given, median = 6.

∴ 6 = 4th observation = x.

Hence, the value of x = 6.

11Chapter Test

The marks scored by 16 students in a class test are :

3, 6, 8, 13, 15, 5, 21, 23, 17, 10, 9, 1, 20, 21, 18, 12.

Find :

(i) the median

(ii) lower quartile

(iii) upper quartile

(iv) inter quartile range.

Show SolutionHide Solution↓

On arranging the numbers in ascending order we get,

1, 3, 5, 6, 8, 9, 10, 12, 13, 15, 17, 18, 20, 21, 21, 23.

(i) Here, n (no. of observations) = 16, which is even.

$$\begin{aligned}\therefore \text{Median} = \frac{\frac{n}{2} \text{th observation} + \big(\frac{n}{2} + 1\big)\text{th observation}}{2} \\[1em] = \frac{\frac{16}{2} \text{th observation} + \big(\frac{16}{2} + 1\big)\text{th observation}}{2} \\[1em] = \frac{\text{ 8th observation + 9th observation}}{2} \\[1em] = \frac{12 + 13}{2} \\[1em] = \frac{25}{2} \\[1em] = 12.5\end{aligned}$$

Hence, the median of following data = 12.5.

(ii) Here, n (no. of observations) = 16, which is even.

$$\begin{aligned}\text{Lower Quartile} = \frac{n}{4}\text{th observation} \\[1em] = \frac{16}{4} \\[1em] = 4\text{th observation} \\[1em] = 6.\end{aligned}$$

Hence, lower quartile = 6.

(iii) Here, n (no. of observations) = 16, which is even.

$$\begin{aligned}\text{Upper Quartile} = \frac{3n}{4}\text{th observation} \\[1em] = \frac{48}{4} \\[1em] = 12\text{th observation} \\[1em] = 18.\end{aligned}$$

Hence, upper quartile = 18.

(iv) Inter quartile range = Upper quartile - Lower quartile = 18 - 6 = 12.

Hence, inter quartile range = 12.

12Chapter Test

Calculate the mean, the median and the mode of the following distribution :

Age in yearsNo. of students
122
133
145
156
164
173
182
Show SolutionHide Solution↓

We construct the table as under :

Age in years (xi)No. of students (fi)Cumulative frequencyfixi
122224
133539
1451070
1561690
1642064
1732351
1822536
Total25374

Mean = $\frac{Σf_ix_i}{Σf_i} = \frac{374}{25}$ = 14.96

Here, n (no. of observations) = 25, which is odd

$$\begin{aligned}\therefore \text{Median} = \frac{n + 1}{2} \text{th observation} \\[1em] = \frac{25 + 1}{2} \\[1em] = \frac{26}{2} \\[1em] = 13 \text{th observation}.\end{aligned}$$

The age of observation from 11th to 16th = 15.

∴ Median = 15.

Highest no. of students are 15 years old.

∴ Mode = 15.

Hence, mean = 14.96, median = 15 and mode = 15.

13Chapter Test

The daily canteen bill of 30 employees in an establishment is distributed as follows :

Daily canteen bill (in ₹)No. of employees
0 - 101
10 - 208
20 - 3010
30 - 405
40 - 504
50 - 602

Estimate the modal daily Canteen bill for this distribution by a graphical method.

Show SolutionHide Solution↓

Steps :

  1. Take 2 cm along x-axis = 10 rupees and 1 cm along y-axis = 1 employee.

  2. Construct rectangles corresponding to the given data.

  3. In highest rectangle, draw two st. lines AC and BD from corners of the rectangles on either side of the highest rectangle to the opposite corners of the highest rectangle. Let P be the point of intersection of AC and BD.

  4. Through P, draw a vertical line to meet the x-axis at M. The abscissa of the point M represents 23.

The daily canteen bill of 30 employees in an establishment are distributed as follows. Estimate the modal daily Canteen bill for this distribution by a graphical method. Measures of Central Tendency, ML Aggarwal Understanding Mathematics Solutions ICSE Class 10.

Hence, the required mode = ₹23.

14Chapter Test

Draw a cumulative frequency curve for the following data :

Marks obtainedNo. of students
0 - 108
10 - 2010
20 - 3022
30 - 4040
40 - 5020

Hence, determine :

(i) the median

(ii) the pass marks if 85% of the students pass.

(iii) the marks which 45% of the students exceed.

Show SolutionHide Solution↓
  1. The cumulative frequency table for the given continuous distribution is :
Marks obtainedNo. of studentsCumulative frequency
0 - 1088
10 - 201018
20 - 302240
30 - 404080
40 - 5020100
  1. Take 2 cm along x-axis = 10 marks

  2. Take 1 cm along y-axis = 10 (students)

  3. Plot the points (10, 8), (20, 18), (30, 40), (40, 80) and (50, 100) representing upper class limits and the respective cumulative frequencies.
    Also plot the point representing lower limit of the first class i.e. 0 - 10.

  4. Join these points by a freehand drawing.

Draw a cumulative frequency curve for the following data. Hence, determine the median, the pass marks if 85% of the students pass, the marks which 45% of the students exceed. Measures of Central Tendency, ML Aggarwal Understanding Mathematics Solutions ICSE Class 10.

The required ogive is shown in figure above.

(i) Here, n (no. of students) = 100.

To find the median :

Let A be the point on y-axis representing frequency = $\frac{n}{2} = \frac{100}{2}$ = 50.

Through A draw a horizontal line to meet the ogive at P. Through P, draw a vertical line to meet the x-axis at M. The abscissa of the point M represents 32.5 marks.

(ii) Total no. of students = 100.

85% of students pass i.e. 85 students pass.

Remaining no. of students = 15.

Let B be the point on y-axis representing frequency 15.

Through B draw a horizontal line to meet the ogive at Q. Through Q, draw a vertical line to meet the x-axis at N. The abscissa of the point N represents 18 marks.

Hence, passing marks = 18 if 85% students pass.

(iii) Total no. of students = 100.

45% of students i.e. 45 students.

Remaining no. of students = 55.

Let C be the point on y-axis representing frequency 55.

Through C draw a horizontal line to meet the ogive at R. Through R, draw a vertical line to meet the x-axis at O. The abscissa of the point O represents 34 marks.

Hence, 45% of students exceed 34 marks.

15Chapter Test

The given graph with a histogram represents the number of plants of different heights grown in a school campus. Study the graph carefully and answer the following questions :

The given graph with a histogram represents the number of plants of different heights grown in a school campus. Study the graph carefully and answer the following questions : ICSE 2024 Maths Solved Question Paper.

(a) Make a frequency table with respect to the class boundaries and their corresponding frequencies.

(b) State the modal class.

(c) Identify and note down the mode of the distribution.

(d) Find the number of plants whose height range is between 80 cm to 90 cm.

Show SolutionHide Solution↓

(a) Frequency table :

Height (class)Number of plants
30-404
40-502
50-608
60-7012
70-806
80-903
90-1004

(b) From graph,

The modal class is 60-70.

(c) From graph,

The mode = 64.

(d) From graph,

The number of plants whose height range is between 80 cm to 90 cm are 3.

Press ↓ to reveal a solution and move to the next question. Back to ML Aggarwal Mathematics.

Free sample bank