9(i)
Study the graph given below and answer the following:
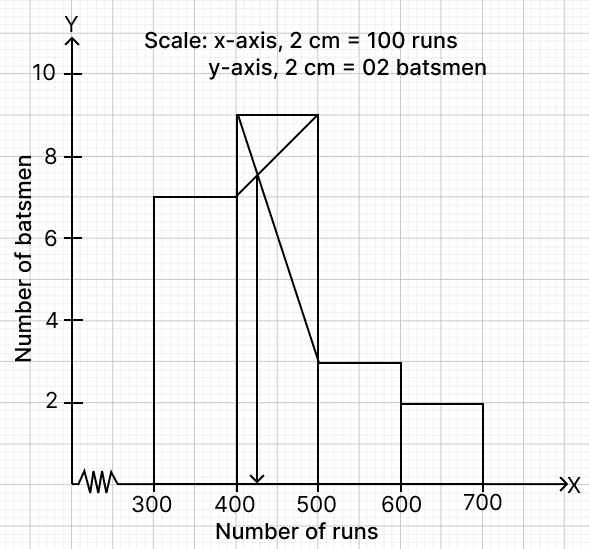
(a) Number of batsmen who scored 500 to 700 runs
(b) Modal class interval
(c) The value of mode
Show SolutionHide Solution↓
(a) From histogram,
The number of batsmen who scored between 500 and 600 runs is 3.
The number of batsmen who scored between 600 and 700 runs is 2.
Thus, the total number of batsmen who scored 500 to 700 runs is 3 + 2 = 5.
Hence, number of batsmen who scored 500 to 700 runs = 5.
(b) The modal class is the class with the highest frequency.
Hence, the modal class interval is 400 - 500.
(c) From graph,
Mode = 430.
Hence, mode = 430.